

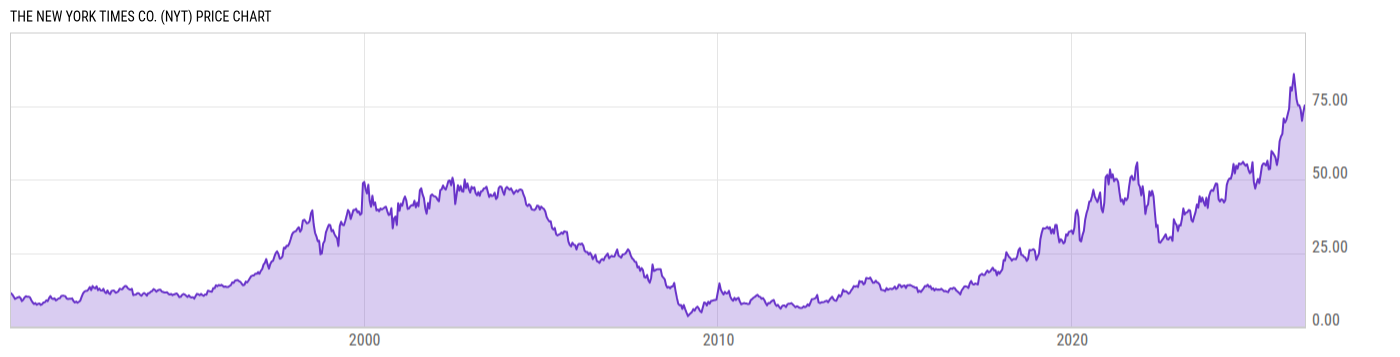
The New York Times Co. (NYT)
74.89
-0.94
(-1.24%)
USD |
NYSE |
Jul 31, 16:00
74.92
+0.03
(+0.04%)
Pre-Market: 20:00
Price Chart
Key Stats
| Price and Performance | |
|---|---|
| Market Cap | 12.12B |
| 52 Week High (Daily) | |
| 52 Week Low (Daily) | |
| All-Time High (Daily) | |
| Year to Date Total Returns (Daily) | |
| 1 Month Total Returns (Daily) | |
| 1 Year Total Returns (Daily) | 46.02% |
| Valuation | |
| PE Ratio | 32.17 |
| PE Ratio (Forward) | |
| PS Ratio | 4.239 |
| Price to Book Value | 6.058 |
| EV to EBITDA | |
| Dividend | |
|---|---|
| Dividend | 0.23 |
| Dividend Yield (Forward) | |
| Financials | |
| Revenue (5 Year Growth) | |
| Revenue (Quarterly YoY Growth) | |
| EPS Diluted (5 Year Growth) | |
| EPS Diluted (Quarterly YoY Growth) | |
| Debt to Equity Ratio | 0.00 |
| Return on Equity | |
| Return on Assets | |
| Risk | |
| Beta (5Y) | |
| Max Drawdown (5Y) | 49.93% |
Profile
| The New York Times Co. is a media organization, which engages in creating, collecting, and distributing news and information. It offers news products and other interest-specific products, and related content and services. It offers newspapers, print, and digital products and investments. The firm also manages The New York Times, NYTimes.com, and mobile applications. The company was founded by Henry Jarvis Raymond and George Jones on September 18, 1851, and is headquartered in New York, NY. |
| URL | http://www.nytco.com |
| Investor Relations URL | https://www.nytco.com/investors/ |
| HQ State/Province | New York |
| Sector | Communication Services |
| Industry | Media |
| Equity Style | Small Cap Core |
| Next Earnings Release | Aug. 05, 2026 |
| Last Earnings Release | May. 06, 2026 |
| Next Ex-Dividend Date | N/A |
| Last Ex-Dividend Date | Jul. 08, 2026 |