

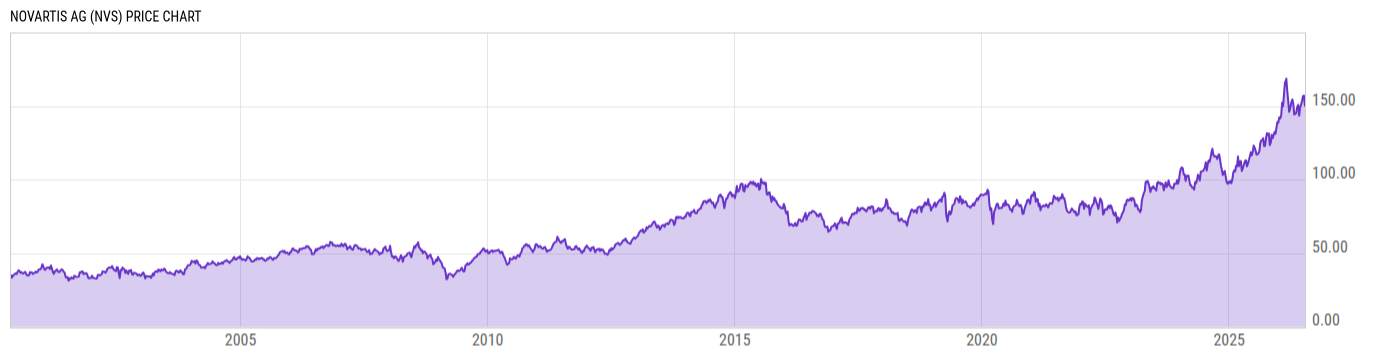
Novartis AG (NVS)
151.26
+0.90
(+0.60%)
USD |
NYSE |
Jul 15, 14:29
Price Chart
Key Stats
| Price and Performance | |
|---|---|
| Market Cap | 288.62B |
| 52 Week High (Daily) | |
| 52 Week Low (Daily) | |
| All-Time High (Daily) | |
| Year to Date Total Returns (Daily) | |
| 1 Month Total Returns (Daily) | |
| 1 Year Total Returns (Daily) | 28.00% |
| Valuation | |
| PE Ratio | 21.56 |
| PE Ratio (Forward) | |
| PS Ratio | 5.359 |
| Price to Book Value | 7.494 |
| EV to EBITDA | |
| Dividend | |
|---|---|
| Dividend | 4.740 |
| Dividend Yield (Forward) | |
| Financials | |
| Revenue (5 Year Growth) | |
| Revenue (Quarterly YoY Growth) | |
| EPS Diluted (5 Year Growth) | |
| EPS Diluted (Quarterly YoY Growth) | |
| Debt to Equity Ratio | 1.220 |
| Return on Equity | |
| Return on Assets | |
| Risk | |
| Beta (5Y) | |
| Max Drawdown (5Y) | 20.42% |
Profile
| Novartis AG is a holding company, which engages in the business of developing, manufacturing, and marketing healthcare products. Its product portfolio is heavily focused on innovative prescription medicines, especially oncology, immunology, neuroscience, and cardiovascular diseases, supplemented by established older brands and a wide range of specialized therapies. The company was founded on February 29, 1996 and is headquartered in Basel, Switzerland. |
| URL | http://www.novartis.com |
| Investor Relations URL | https://www.novartis.com/investors |
| HQ State/Province | Basel-Stadt (Basle Town) |
| Sector | Health Care |
| Industry | Pharmaceuticals |
| Equity Style | Large Cap Core |
| Next Earnings Release | Jul. 21, 2026 |
| Last Earnings Release | Apr. 28, 2026 |
| Next Ex-Dividend Date | N/A |
| Last Ex-Dividend Date | Mar. 11, 2026 |