

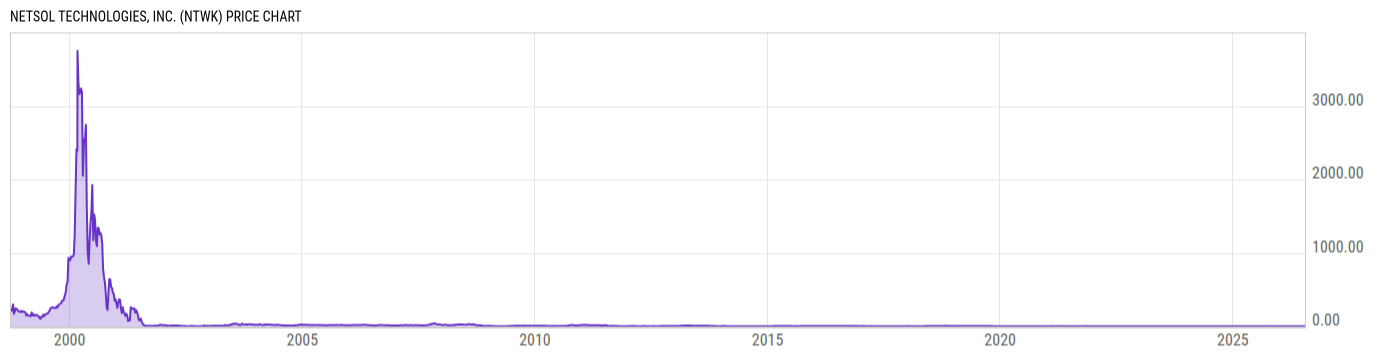
NetSol Technologies, Inc. (NTWK)
4.51
+0.14
(+3.20%)
USD |
NASDAQ |
Jul 21, 16:00
4.51
0.00 (0.00%)
After-Hours: 20:00
Price Chart
Key Stats
| Price and Performance | |
|---|---|
| Market Cap | 53.43M |
| 52 Week High (Daily) | |
| 52 Week Low (Daily) | |
| All-Time High (Daily) | |
| Year to Date Total Returns (Daily) | |
| 1 Month Total Returns (Daily) | |
| 1 Year Total Returns (Daily) | 13.21% |
| Valuation | |
| PE Ratio | 30.17 |
| PE Ratio (Forward) | |
| PS Ratio | 0.7381 |
| Price to Book Value | 1.437 |
| EV to EBITDA | |
| Dividend | |
|---|---|
| Dividend | -- |
| Dividend Yield (Forward) | |
| Financials | |
| Revenue (5 Year Growth) | |
| Revenue (Quarterly YoY Growth) | |
| EPS Diluted (5 Year Growth) | |
| EPS Diluted (Quarterly YoY Growth) | |
| Debt to Equity Ratio | 0.2511 |
| Return on Equity | |
| Return on Assets | |
| Risk | |
| Beta (5Y) | |
| Max Drawdown (5Y) | 83.29% |
Profile
| NetSol Technologies, Inc. engages in the provision of information technology and enterprise software solutions. The firm activities include licensing, subscriptions, modification, enhancement, and support of its suite of financial applications under the brand name NFS Ascent. It operates through the following geographical segments: North America, Europe, and Asia-Pacific. The company was founded by Najeeb Ullah Ghauri, Salim Ullah Ghauri, Naeem Ullah Ghauri, and Irfan Mustafa on March 18, 1997 and is headquartered in Encino, CA. |
| URL | http://www.netsoltech.com |
| Investor Relations URL | http://ir.netsoltech.com/ |
| HQ State/Province | California |
| Sector | Information Technology |
| Industry | Software |
| Equity Style | Small Cap Core |
| Next Earnings Release | Sep. 28, 2026 (est.) |
| Last Earnings Release | May. 14, 2026 |
| Next Ex-Dividend Date | N/A |
| Last Ex-Dividend Date | N/A |