

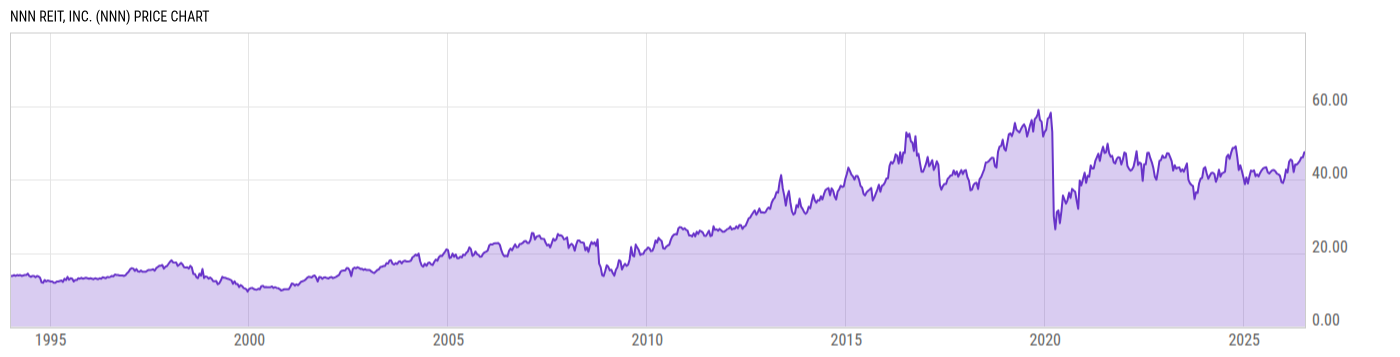
NNN REIT, Inc. (NNN)
47.36
+0.59
(+1.26%)
USD |
NYSE |
Jul 13, 16:00
47.36
0.00 (0.00%)
Pre-Market: 20:00
Price Chart
Key Stats
| Price and Performance | |
|---|---|
| Market Cap | 9.010B |
| 52 Week High (Daily) | |
| 52 Week Low (Daily) | |
| All-Time High (Daily) | |
| Year to Date Total Returns (Daily) | |
| 1 Month Total Returns (Daily) | |
| 1 Year Total Returns (Daily) | 16.17% |
| Valuation | |
| PE Ratio | 23.10 |
| PE Ratio (Forward) | |
| PS Ratio | 9.541 |
| Price to Book Value | 2.05 |
| EV to EBITDA | |
| Dividend | |
|---|---|
| Dividend | 0.60 |
| Dividend Yield (Forward) | |
| Financials | |
| Revenue (5 Year Growth) | |
| Revenue (Quarterly YoY Growth) | |
| EPS Diluted (5 Year Growth) | |
| EPS Diluted (Quarterly YoY Growth) | |
| Debt to Equity Ratio | 1.107 |
| Return on Equity | |
| Return on Assets | |
| Risk | |
| Beta (5Y) | |
| Max Drawdown (5Y) | 29.33% |
Profile
| NNN REIT, Inc. is a real estate investment trust, which engages in investing in properties subject to long-term net leases. It acquires, owns, invests in, and develops properties that are leased to retail tenants under long-term net leases and held for investment. The company was founded on August 8, 1984, and is headquartered in Orlando, FL. |
| URL | http://www.nnnreit.com |
| Investor Relations URL | https://www.nnnreit.com/investor-relations/ |
| HQ State/Province | Florida |
| Sector | Real Estate |
| Industry | Retail REITs |
| Equity Style | Small Cap Core |
| Next Earnings Release | Aug. 05, 2026 |
| Last Earnings Release | Apr. 30, 2026 |
| Next Ex-Dividend Date | N/A |
| Last Ex-Dividend Date | Apr. 30, 2026 |