

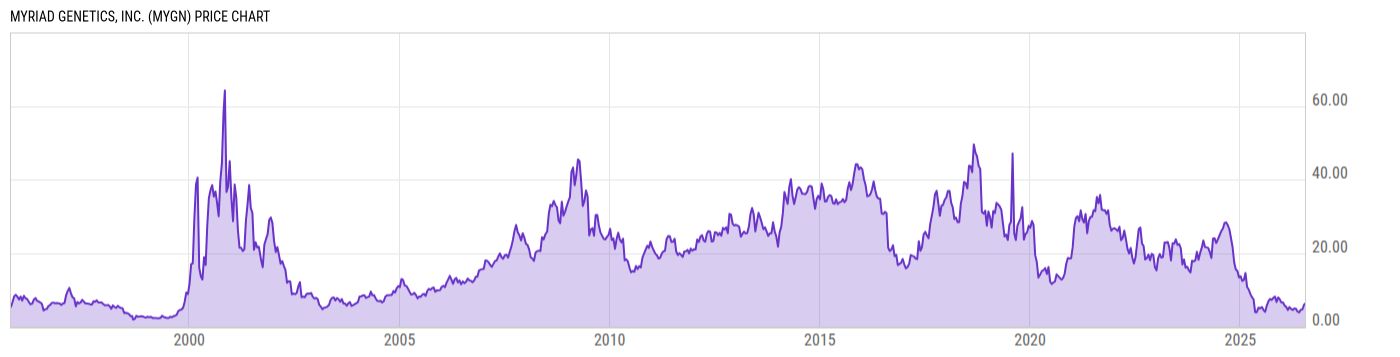
Myriad Genetics, Inc. (MYGN)
6.19
-0.12
(-1.90%)
USD |
NASDAQ |
Jul 16, 16:00
6.205
+0.02
(+0.24%)
After-Hours: 20:00
Price Chart
Key Stats
| Price and Performance | |
|---|---|
| Market Cap | 584.34M |
| 52 Week High (Daily) | |
| 52 Week Low (Daily) | |
| All-Time High (Daily) | |
| Year to Date Total Returns (Daily) | |
| 1 Month Total Returns (Daily) | |
| 1 Year Total Returns (Daily) | 22.33% |
| Valuation | |
| PE Ratio | -- |
| PE Ratio (Forward) | |
| PS Ratio | 0.6955 |
| Price to Book Value | 1.732 |
| EV to EBITDA | |
| Dividend | |
|---|---|
| Dividend | -- |
| Dividend Yield (Forward) | |
| Financials | |
| Revenue (5 Year Growth) | |
| Revenue (Quarterly YoY Growth) | |
| EPS Diluted (5 Year Growth) | |
| EPS Diluted (Quarterly YoY Growth) | |
| Debt to Equity Ratio | 0.6269 |
| Return on Equity | |
| Return on Assets | |
| Risk | |
| Beta (5Y) | |
| Max Drawdown (5Y) | 90.32% |
Profile
| Myriad Genetics, Inc. is a molecular diagnostics and precision medicine company committed to advancing health and well-being for all. It develops and commercializes molecular tests that help patients and providers uncover genetic insights. The company was founded by Walter A. Gilbert, Mark H. Skolnick, and Peter D. Meldrum in May 1991 and is headquartered in Salt Lake City, UT. |
| URL | http://www.myriad.com |
| Investor Relations URL | https://investor.myriad.com/ |
| HQ State/Province | Utah |
| Sector | Health Care |
| Industry | Biotechnology |
| Equity Style | Small Cap Value |
| Next Earnings Release | Aug. 04, 2026 (est.) |
| Last Earnings Release | May. 05, 2026 |
| Next Ex-Dividend Date | N/A |
| Last Ex-Dividend Date | N/A |