

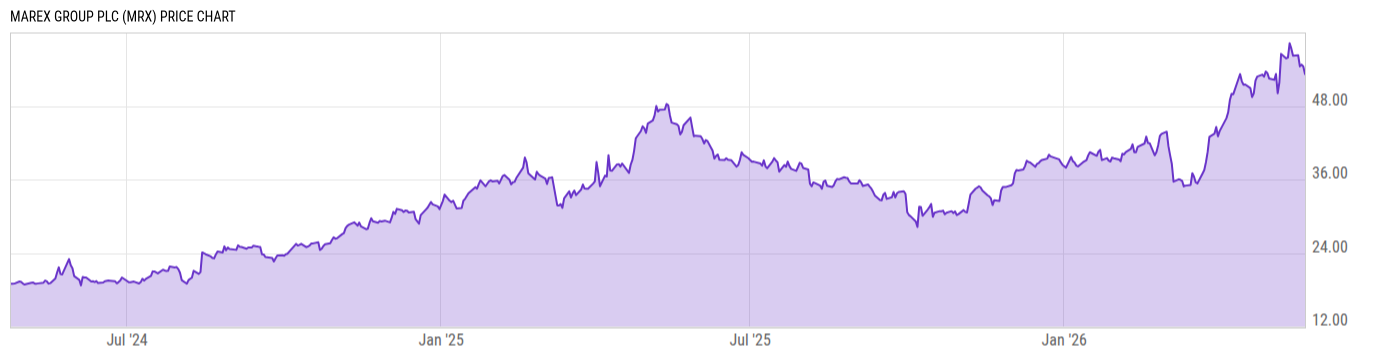
Marex Group Plc (MRX)
57.99
+2.88
(+5.23%)
USD |
NASDAQ |
Jun 08, 16:00
58.51
+0.52
(+0.90%)
After-Hours: 20:00
Price Chart
Key Stats
| Price and Performance | |
|---|---|
| Market Cap | 4.102B |
| 52 Week High (Daily) | |
| 52 Week Low (Daily) | |
| All-Time High (Daily) | |
| Year to Date Total Returns (Daily) | |
| 1 Month Total Returns (Daily) | |
| 1 Year Total Returns (Daily) | 39.36% |
| Valuation | |
| PE Ratio | 13.40 |
| PE Ratio (Forward) | |
| PS Ratio | 1.095 |
| Price to Book Value | 3.278 |
| EV to EBITDA | |
| Dividend | |
|---|---|
| Dividend | 0.16 |
| Dividend Yield (Forward) | |
| Financials | |
| Revenue (5 Year Growth) | |
| Revenue (Quarterly YoY Growth) | |
| EPS Diluted (5 Year Growth) | |
| EPS Diluted (Quarterly YoY Growth) | |
| Debt to Equity Ratio | 7.683 |
| Return on Equity | |
| Return on Assets | |
| Risk | |
| Beta (5Y) | |
| Max Drawdown (5Y) | -- |
Profile
| Marex Group Plc provides brokerage services for commodities, financials, and foreign exchange. It operates through the following segments: Clearing, Agency and Execution, Market Making, Hedging and Investment Solutions, and Corporate. The Clearing segment allows the clients access to exchanges and clearing houses. The Agency and Execution segment match buyers and sellers on an agency basis by facilitating price discovery of commodities and financial markets. The Market Making segment offers direct market pricing to professional and wholesale counterparties in a variety of commodity and securities markets. The Corporate segment includes the group’s control and support functions. The company was founded by Mark Slade in 2005 and is headquartered in London, the United Kingdom. |
| URL | http://www.marex.com |
| Investor Relations URL | N/A |
| HQ State/Province | Greater London |
| Sector | Financials |
| Industry | Capital Markets |
| Next Earnings Release | Aug. 12, 2026 (est.) |
| Last Earnings Release | May. 06, 2026 |
| Next Ex-Dividend Date | N/A |
| Last Ex-Dividend Date | May. 18, 2026 |