

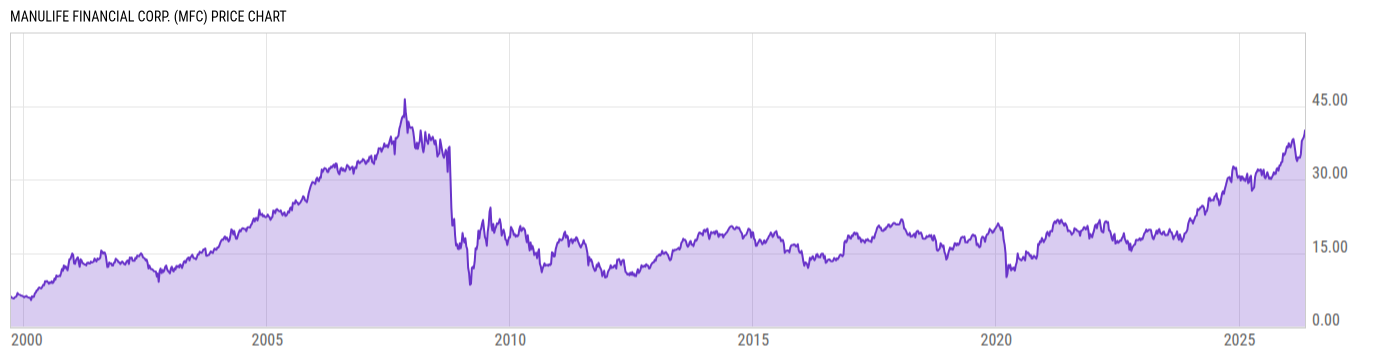
Manulife Financial Corp. (MFC)
38.90
+0.19
(+0.49%)
USD |
NYSE |
Jun 08, 16:00
38.90
0.00 (0.00%)
After-Hours: 20:00
Price Chart
Key Stats
| Price and Performance | |
|---|---|
| Market Cap | 65.04B |
| 52 Week High (Daily) | |
| 52 Week Low (Daily) | |
| All-Time High (Daily) | |
| Year to Date Total Returns (Daily) | |
| 1 Month Total Returns (Daily) | |
| 1 Year Total Returns (Daily) | 25.56% |
| Valuation | |
| PE Ratio | 15.45 |
| PE Ratio (Forward) | |
| PS Ratio | 1.489 |
| Price to Book Value | 2.064 |
| EV to EBITDA | |
| Dividend | |
|---|---|
| Dividend | 0.3534 |
| Dividend Yield (Forward) | |
| Financials | |
| Revenue (5 Year Growth) | |
| Revenue (Quarterly YoY Growth) | |
| EPS Diluted (5 Year Growth) | |
| EPS Diluted (Quarterly YoY Growth) | |
| Debt to Equity Ratio | 0.2656 |
| Return on Equity | |
| Return on Assets | |
| Risk | |
| Beta (5Y) | |
| Max Drawdown (5Y) | 26.94% |
Profile
| Manulife Financial Corp. engages in the provision of financial services and insurance for individuals, groups, and businesses. It operates through the following segments: Asia, Canada, U.S., Global Wealth and Asset Management (WAM), and Corporate and Other. The Asia segment offers insurance products and insurance-based wealth accumulation products. The Canada segment includes insurance products, insurance-based wealth accumulation products, and banking services. The U.S. segment consists of life insurance products and insurance-based wealth accumulation products and has an in-force long-term care insurance business and an in-force annuity business. The Global WAM segment delivers investment solutions to retail, retirement, and institutional clients. The Corporate and Other segment refers to investment performance on assets backing capital, costs incurred by the corporate office related to shareholder activities, property and casualty reinsurance business, and run-off reinsurance operation including variable annuities and accident and health. The company was founded in 1887 and is headquartered in Toronto, Canada. |
| URL | http://www.manulife.com |
| Investor Relations URL | https://www.manulife.com/ca/en/about-us/investors |
| HQ State/Province | Ontario |
| Sector | Financials |
| Industry | Insurance |
| Next Earnings Release | Aug. 05, 2026 |
| Last Earnings Release | May. 13, 2026 |
| Next Ex-Dividend Date | N/A |
| Last Ex-Dividend Date | May. 29, 2026 |