

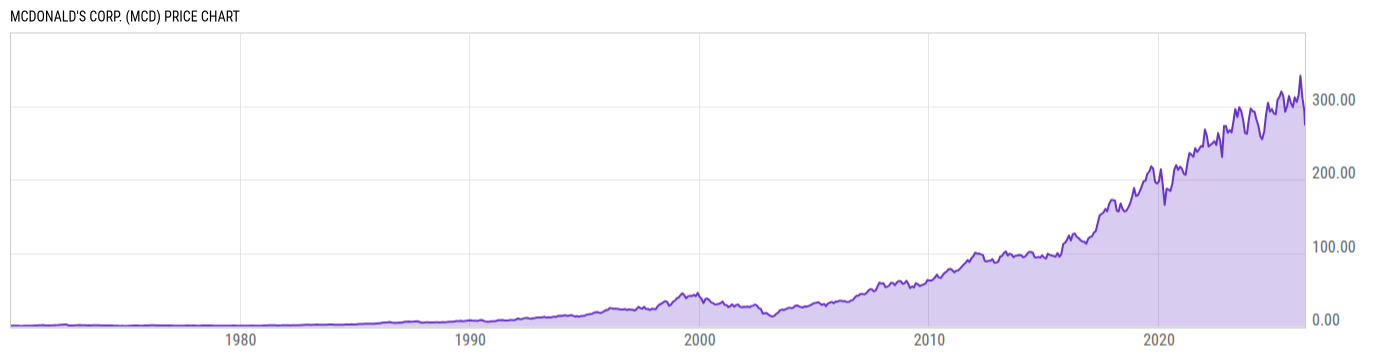
McDonald's Corp. (MCD)
280.04
-2.23
(-0.79%)
USD |
NYSE |
May 26, 12:04
Price Chart
Key Stats
| Price and Performance | |
|---|---|
| Market Cap | 198.97B |
| 52 Week High (Daily) | |
| 52 Week Low (Daily) | |
| All-Time High (Daily) | |
| Year to Date Total Returns (Daily) | |
| 1 Month Total Returns (Daily) | |
| 1 Year Total Returns (Daily) | -8.11% |
| Valuation | |
| PE Ratio | 23.08 |
| PE Ratio (Forward) | |
| PS Ratio | 7.298 |
| Price to Book Value | -- |
| EV to EBITDA | |
| Dividend | |
|---|---|
| Dividend | 1.86 |
| Dividend Yield (Forward) | |
| Financials | |
| Revenue (5 Year Growth) | |
| Revenue (Quarterly YoY Growth) | |
| EPS Diluted (5 Year Growth) | |
| EPS Diluted (Quarterly YoY Growth) | |
| Debt to Equity Ratio | -42.68 |
| Return on Equity | |
| Return on Assets | |
| Risk | |
| Beta (5Y) | |
| Max Drawdown (5Y) | 17.22% |
Profile
| McDonald's Corp. engages in the operation and franchising of restaurants. The firm operates through the following segments: U.S., International Operated Markets, and International Developmental Licensed Markets and Corporate. The U.S. segment focuses its operations on the United States. The International Operated Markets segment consists of operations and the franchising of restaurants in Australia, Canada, France, Germany, Italy, the Netherlands, Russia, Spain, and the U.K. The International Developmental Licensed Markets and Corporate segment consists of developmental licensee and affiliate markets in the McDonald’s system. Its products include Big Mac, Quarter Pounder with Cheese, Filet-O-Fish, several chicken sandwiches, Chicken McNuggets, wraps, McDonald's Fries, salads, oatmeal, shakes, McFlurry desserts, sundaes, soft serve cones, pies, soft drinks, coffee, and McCafe beverages. The company was founded by Raymond Albert Kroc on April 15, 1955 and is headquartered in Chicago, IL. |
| URL | http://corporate.mcdonalds.com |
| Investor Relations URL | https://corporate.mcdonalds.com/corpmcd/investors.html |
| HQ State/Province | Illinois |
| Sector | Consumer Discretionary |
| Industry | Hotels, Restaurants & Leisure |
| Next Earnings Release | Aug. 06, 2026 (est.) |
| Last Earnings Release | May. 07, 2026 |
| Next Ex-Dividend Date | Jun. 02, 2026 |
| Last Ex-Dividend Date | Mar. 03, 2026 |