

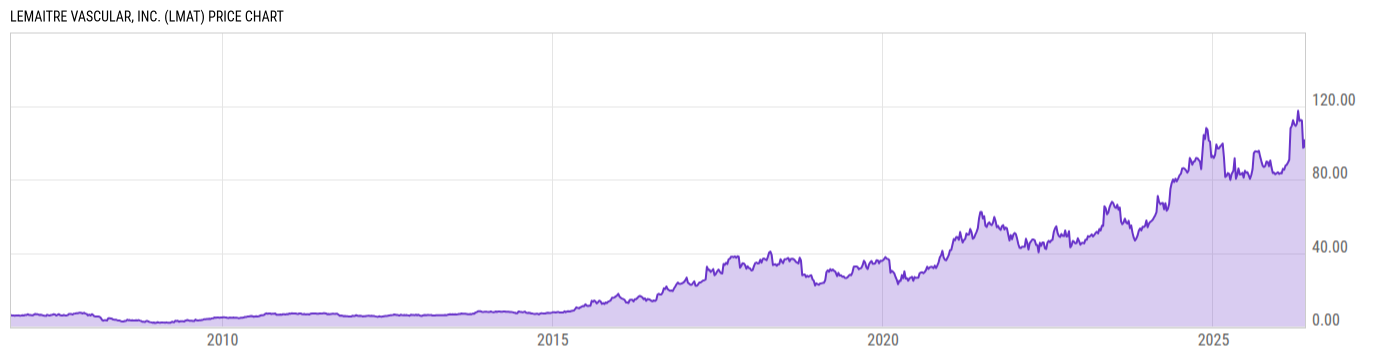
LeMaitre Vascular, Inc. (LMAT)
97.75
-1.77
(-1.78%)
USD |
NASDAQ |
May 22, 16:00
97.72
-0.03
(-0.03%)
After-Hours: 20:00
Price Chart
Key Stats
| Price and Performance | |
|---|---|
| Market Cap | 2.234B |
| 52 Week High (Daily) | |
| 52 Week Low (Daily) | |
| All-Time High (Daily) | |
| Year to Date Total Returns (Daily) | |
| 1 Month Total Returns (Daily) | |
| 1 Year Total Returns (Daily) | 24.70% |
| Valuation | |
| PE Ratio | 36.02 |
| PE Ratio (Forward) | |
| PS Ratio | 8.895 |
| Price to Book Value | 5.493 |
| EV to EBITDA | |
| Dividend | |
|---|---|
| Dividend | 0.25 |
| Dividend Yield (Forward) | |
| Financials | |
| Revenue (5 Year Growth) | |
| Revenue (Quarterly YoY Growth) | |
| EPS Diluted (5 Year Growth) | |
| EPS Diluted (Quarterly YoY Growth) | |
| Debt to Equity Ratio | 0.4668 |
| Return on Equity | |
| Return on Assets | |
| Risk | |
| Beta (5Y) | |
| Max Drawdown (5Y) | 37.92% |
Profile
| LeMaitre Vascular, Inc. engages in the provision of medical devices and human tissue cryopreservation services. The company focuses on the design, marketing, sales, service, and technical support of medical devices and implants for the treatment of peripheral vascular disease. Its products include balloon catheters, carotid shunts, biologic patches, radiopaque marking tape, anastomotic clips, remote endarterectomy devices, laparoscopic cholecystectomy devices, vascular grafts, and powered phlebectomy. The company was founded by George D. LeMaitre on November 28, 1983 and is headquartered in Burlington, MA. |
| URL | http://www.lemaitre.com |
| Investor Relations URL | http://ir.lemaitre.com |
| HQ State/Province | Massachusetts |
| Sector | Health Care |
| Industry | Health Care Equipment & Supplies |
| Next Earnings Release | Aug. 10, 2026 (est.) |
| Last Earnings Release | May. 05, 2026 |
| Next Ex-Dividend Date | N/A |
| Last Ex-Dividend Date | May. 21, 2026 |