

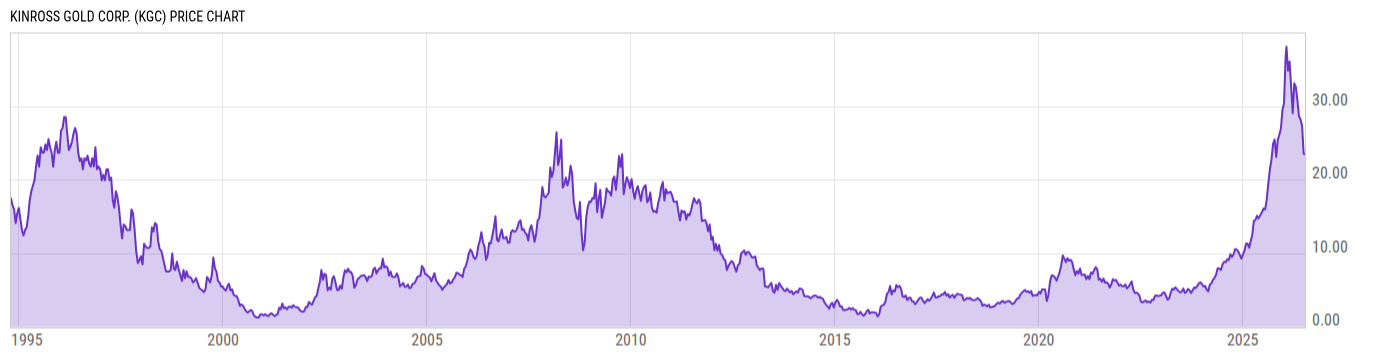
Kinross Gold Corp. (KGC)
23.46
-0.68
(-2.80%)
USD |
NYSE |
Jul 13, 16:00
23.45
-0.02
(-0.06%)
After-Hours: 20:00
Price Chart
Key Stats
| Price and Performance | |
|---|---|
| Market Cap | 28.02B |
| 52 Week High (Daily) | |
| 52 Week Low (Daily) | |
| All-Time High (Daily) | |
| Year to Date Total Returns (Daily) | |
| 1 Month Total Returns (Daily) | |
| 1 Year Total Returns (Daily) | 58.22% |
| Valuation | |
| PE Ratio | 9.939 |
| PE Ratio (Forward) | |
| PS Ratio | 3.583 |
| Price to Book Value | 3.080 |
| EV to EBITDA | |
| Dividend | |
|---|---|
| Dividend | 0.04 |
| Dividend Yield (Forward) | |
| Financials | |
| Revenue (5 Year Growth) | |
| Revenue (Quarterly YoY Growth) | |
| EPS Diluted (5 Year Growth) | |
| EPS Diluted (Quarterly YoY Growth) | |
| Debt to Equity Ratio | 0.0812 |
| Return on Equity | |
| Return on Assets | |
| Risk | |
| Beta (5Y) | |
| Max Drawdown (5Y) | 67.89% |
Profile
| Kinross Gold Corp. engages in the production, acquisition, exploration, and development of gold properties. The firm operates through the following business segments: Tasiast, Paracatu, La Coipa, Fort Knox, Round Mountain, Bald Mountain, and Corporate & Other. The Fort Knox segment includes Fort Knox and Manh Choh mine. Its mining operations are in the United States, Brazil, Chile, Mauritania, and Canada. The company was founded by Robert MacKay Buchan on May 31, 1993 and is headquartered in Toronto, Canada. |
| URL | http://www.kinross.com |
| Investor Relations URL | https://www.kinross.com/news-and-investors/ |
| HQ State/Province | Ontario |
| Sector | Materials |
| Industry | Metals & Mining |
| Equity Style | Mid Cap Core |
| Next Earnings Release | Jul. 29, 2026 |
| Last Earnings Release | Apr. 29, 2026 |
| Next Ex-Dividend Date | N/A |
| Last Ex-Dividend Date | May. 21, 2026 |