

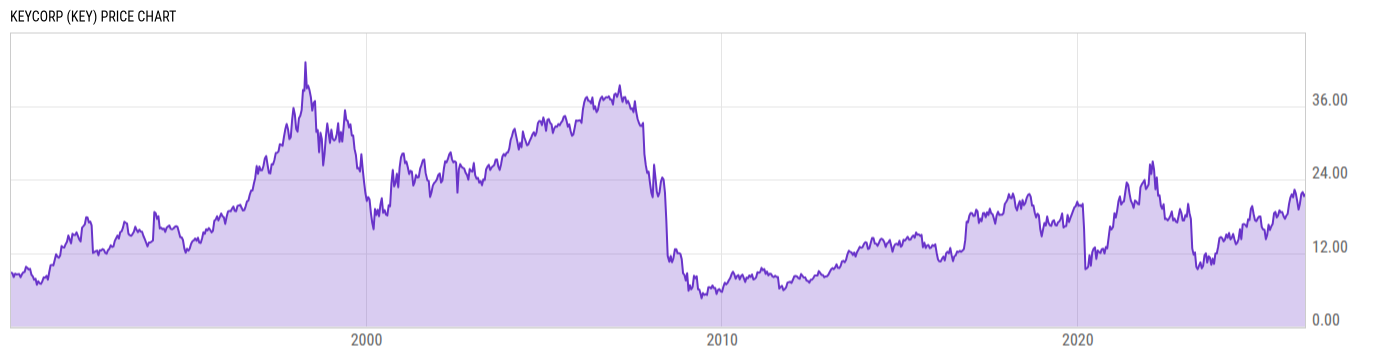
KeyCorp (KEY)
22.61
-0.14
(-0.62%)
USD |
NYSE |
Jun 17, 16:00
22.61
0.00 (0.00%)
After-Hours: 16:13
Price Chart
Key Stats
| Price and Performance | |
|---|---|
| Market Cap | 24.58B |
| 52 Week High (Daily) | |
| 52 Week Low (Daily) | |
| All-Time High (Daily) | |
| Year to Date Total Returns (Daily) | |
| 1 Month Total Returns (Daily) | |
| 1 Year Total Returns (Daily) | 48.86% |
| Valuation | |
| PE Ratio | 13.85 |
| PE Ratio (Forward) | |
| PS Ratio | 2.243 |
| Price to Book Value | 1.406 |
| EV to EBITDA | |
| Dividend | |
|---|---|
| Dividend | 0.205 |
| Dividend Yield (Forward) | |
| Financials | |
| Revenue (5 Year Growth) | |
| Revenue (Quarterly YoY Growth) | |
| EPS Diluted (5 Year Growth) | |
| EPS Diluted (Quarterly YoY Growth) | |
| Debt to Equity Ratio | 0.854 |
| Return on Equity | |
| Return on Assets | |
| Risk | |
| Beta (5Y) | |
| Max Drawdown (5Y) | 65.22% |
Profile
| KeyCorp is a bank holding company, which engages in the provision of financial services. It operates through the Consumer Bank and Commercial Bank segments. The Consumer Bank segment offers deposit and investment products, personal finance and financial wellness services, lending, mortgage and home equity, student loan refinancing, credit card, treasury services, and business advisory services. The Commercial Bank segment focuses on serving the needs of middle market clients in seven industry sectors, consumer, energy, healthcare, industrial, public sector, real estate, and technology. The company was founded on December 31, 1958 and is headquartered in Cleveland, OH. |
| URL | http://www.key.com |
| Investor Relations URL | https://investor.key.com |
| HQ State/Province | Ohio |
| Sector | Financials |
| Industry | Banks |
| Equity Style | Small Cap Value |
| Next Earnings Release | Jul. 21, 2026 |
| Last Earnings Release | Apr. 16, 2026 |
| Next Ex-Dividend Date | N/A |
| Last Ex-Dividend Date | Jun. 02, 2026 |