

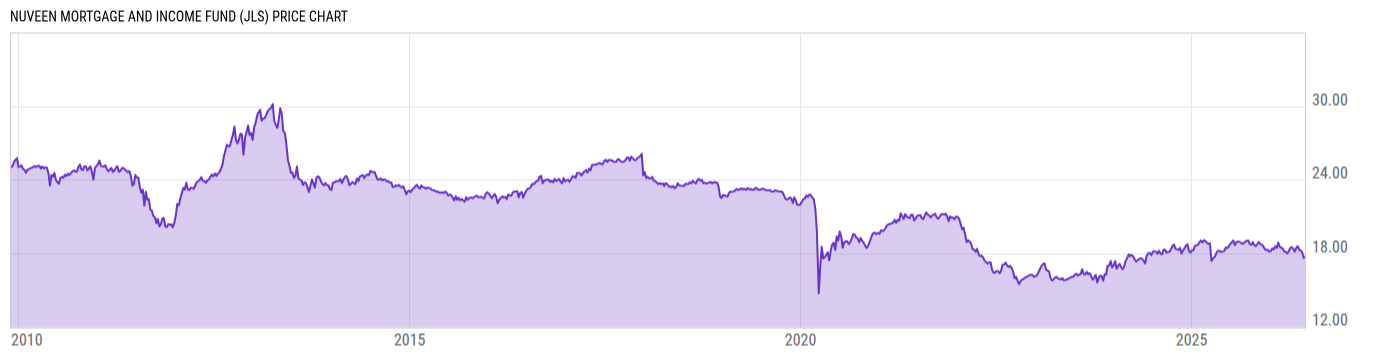
Nuveen Mortgage and Income Fund (JLS)
17.68
-0.24
(-1.34%)
USD |
NYSE |
Jun 15, 16:00
17.69
+0.01
(+0.06%)
After-Hours: 20:00
Price Chart
Key Stats
| Net Expense Ratio | Discount or Premium to NAV | Total Assets Under Management | 30-Day Average Daily Volume |
|---|---|---|---|
| 3.07% | -6.11% | -- | 24030.23 |
| Weighted Average Dividend Yield | Turnover Ratio (Generic) | 1 Year Fund Level Flows | Max Drawdown (Since Inception) |
| -- | 23.00% | -- |
Basic Info
| Investment Strategy | |
| The Fund seeks to generate attractive total returns through opportunistic investments in mortgage backed securities. The Fund seeks to capitalize on the potential for recovery in the U.S. residential and commercial real estate markets, and a corresponding recovery in valuations of mortgage securities. |
| General | |
| Security Type | Closed-End Fund |
| Equity Style | -- |
| Broad Asset Class | Taxable Bond |
| Broad Category | Fixed Income |
| Global Peer Group | Bond USD Mortgages |
| Peer Group | U.S. Mortgage Funds |
| Global Macro | Bond HC |
| US Macro | U.S. Government & Treasury Fixed Income Funds |
| YCharts Categorization | -- |
| YCharts Benchmark | -- |
| Prospectus Objective | U.S. Mortgage Funds |
| Fund Owner Firm Name | Nuveen |
| Broad Asset Class Benchmark Index | |
| ^BBUSATR | 100.0% |
Performance Versus Peer Group
Annual Total Returns Versus Peers
As of June 16, 2026.
Asset Allocation
As of April 30, 2026.
| Type | % Net |
|---|---|
| Cash | -49.24% |
| Stock | 0.00% |
| Bond | 129.1% |
| Convertible | 0.00% |
| Preferred | 0.00% |
| Other | 20.19% |
Basic Info
| Investment Strategy | |
| The Fund seeks to generate attractive total returns through opportunistic investments in mortgage backed securities. The Fund seeks to capitalize on the potential for recovery in the U.S. residential and commercial real estate markets, and a corresponding recovery in valuations of mortgage securities. |
| General | |
| Security Type | Closed-End Fund |
| Equity Style | -- |
| Broad Asset Class | Taxable Bond |
| Broad Category | Fixed Income |
| Global Peer Group | Bond USD Mortgages |
| Peer Group | U.S. Mortgage Funds |
| Global Macro | Bond HC |
| US Macro | U.S. Government & Treasury Fixed Income Funds |
| YCharts Categorization | -- |
| YCharts Benchmark | -- |
| Prospectus Objective | U.S. Mortgage Funds |
| Fund Owner Firm Name | Nuveen |
| Broad Asset Class Benchmark Index | |
| ^BBUSATR | 100.0% |