

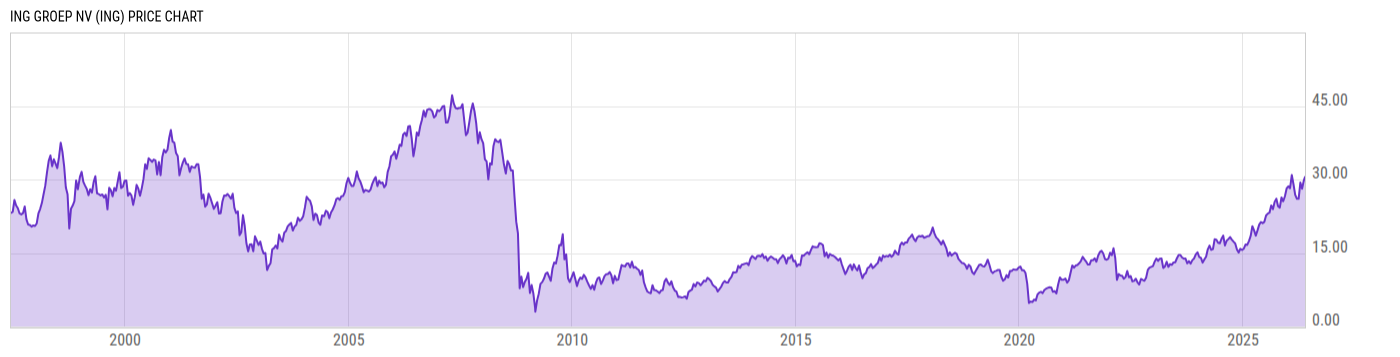
ING Groep NV (ING)
29.11
-0.56
(-1.89%)
USD |
NYSE |
Jun 08, 16:00
29.10
0.00 (0.00%)
After-Hours: 20:00
Price Chart
Key Stats
| Price and Performance | |
|---|---|
| Market Cap | 83.74B |
| 52 Week High (Daily) | |
| 52 Week Low (Daily) | |
| All-Time High (Daily) | |
| Year to Date Total Returns (Daily) | |
| 1 Month Total Returns (Daily) | |
| 1 Year Total Returns (Daily) | 47.98% |
| Valuation | |
| PE Ratio | 11.51 |
| PE Ratio (Forward) | |
| PS Ratio | 3.185 |
| Price to Book Value | 1.429 |
| EV to EBITDA | |
| Dividend | |
|---|---|
| Dividend | 0.8606 |
| Dividend Yield (Forward) | |
| Financials | |
| Revenue (5 Year Growth) | |
| Revenue (Quarterly YoY Growth) | |
| EPS Diluted (5 Year Growth) | |
| EPS Diluted (Quarterly YoY Growth) | |
| Debt to Equity Ratio | 4.232 |
| Return on Equity | |
| Return on Assets | |
| Risk | |
| Beta (5Y) | |
| Max Drawdown (5Y) | 48.14% |
Profile
| ING Groep NV engages in the provision of banking, investments, life and non-life insurance, and retirement and asset management services. It operates through the following segments: Retail Netherlands, Retail Belgium, Retail Germany, Retail Other, and Wholesale Banking. The Retail Netherlands segment offers current and savings accounts, business lending, mortgages, and consumer lending. The Retail Belgium segment provides banking, life and non-life insurance, and asset management products and services. The Retail Germany segment deals with retail and private banking, which offers current and savings accounts, mortgages, and customer lending. The Retail Other segment covers income from retail banking activities. The Wholesale Banking segment includes cash management to corporate finance, real estate, and lease. The company was founded on March 4, 1991 and is headquartered in Amsterdam, the Netherlands. |
| URL | http://www.ing.com |
| Investor Relations URL | https://ing.com/investors/investor-overview |
| HQ State/Province | Noord-Holland |
| Sector | Financials |
| Industry | Banks |
| Next Earnings Release | Jul. 30, 2026 |
| Last Earnings Release | Apr. 30, 2026 |
| Next Ex-Dividend Date | N/A |
| Last Ex-Dividend Date | Apr. 17, 2026 |