

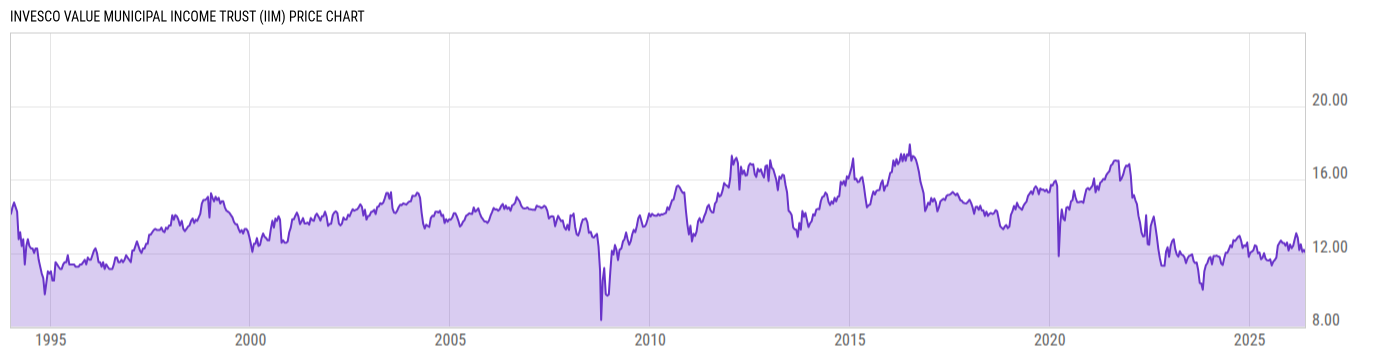
Invesco Value Municipal Income Trust (IIM)
12.51
-0.04
(-0.32%)
USD |
NYSE |
Jun 16, 16:00
12.51
0.00 (0.00%)
Pre-Market: 19:59
Price Chart
Key Stats
| Net Expense Ratio | Discount or Premium to NAV | Total Assets Under Management | 30-Day Average Daily Volume |
|---|---|---|---|
| 2.93% | 1.38% | -- | 112521.2 |
| Weighted Average Dividend Yield | Turnover Ratio (Generic) | 1 Year Fund Level Flows | Max Drawdown (Since Inception) |
| -- | 19.00% | -- |
Basic Info
| Investment Strategy | |
| The Trust seeks to provide investors with a high level of current income exempt from federal income tax, with liquidity and safety of principal, primarily by investing in a diversified portfolio of municipal securities rated A or higher. |
| General | |
| Security Type | Closed-End Fund |
| Equity Style | -- |
| Broad Asset Class | Municipal Bond |
| Broad Category | Fixed Income |
| Global Peer Group | Bond USD Municipal |
| Peer Group | General & Insured Muni Debt Funds (Leveraged) |
| Global Macro | Bond HC |
| US Macro | -- |
| YCharts Categorization | -- |
| YCharts Benchmark | -- |
| Prospectus Objective | Gen & Ins Muni Debt Funds (Leveraged) |
| Fund Owner Firm Name | Invesco |
| Broad Asset Class Benchmark Index | |
| ^BBMBTR | 100.0% |
Performance Versus Peer Group
Annual Total Returns Versus Peers
As of June 17, 2026.
Asset Allocation
As of April 30, 2026.
| Type | % Net |
|---|---|
| Cash | 0.54% |
| Stock | 0.00% |
| Bond | 99.46% |
| Convertible | 0.00% |
| Preferred | 0.00% |
| Other | 0.00% |
Basic Info
| Investment Strategy | |
| The Trust seeks to provide investors with a high level of current income exempt from federal income tax, with liquidity and safety of principal, primarily by investing in a diversified portfolio of municipal securities rated A or higher. |
| General | |
| Security Type | Closed-End Fund |
| Equity Style | -- |
| Broad Asset Class | Municipal Bond |
| Broad Category | Fixed Income |
| Global Peer Group | Bond USD Municipal |
| Peer Group | General & Insured Muni Debt Funds (Leveraged) |
| Global Macro | Bond HC |
| US Macro | -- |
| YCharts Categorization | -- |
| YCharts Benchmark | -- |
| Prospectus Objective | Gen & Ins Muni Debt Funds (Leveraged) |
| Fund Owner Firm Name | Invesco |
| Broad Asset Class Benchmark Index | |
| ^BBMBTR | 100.0% |