

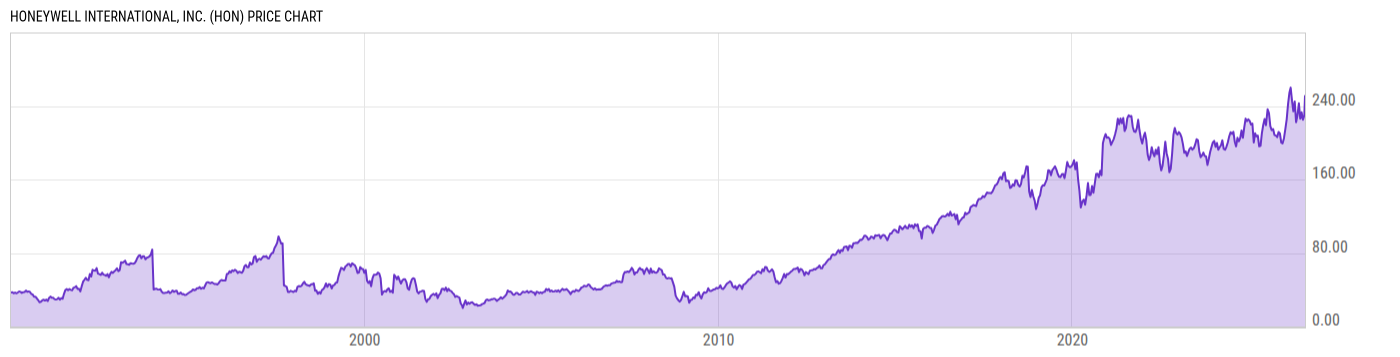
Honeywell International, Inc. (HON)
247.00
+1.25
(+0.51%)
USD |
NASDAQ |
Jul 28, 16:00
247.59
+0.59
(+0.24%)
After-Hours: 20:00
Price Chart
Key Stats
| Price and Performance | |
|---|---|
| Market Cap | 78.28B |
| 52 Week High (Daily) | |
| 52 Week Low (Daily) | |
| All-Time High (Daily) | |
| Year to Date Total Returns (Daily) | |
| 1 Month Total Returns (Daily) | |
| 1 Year Total Returns (Daily) | 13.39% |
| Valuation | |
| PE Ratio | 9.133 |
| PE Ratio (Forward) | |
| PS Ratio | 2.020 |
| Price to Book Value | 4.223 |
| EV to EBITDA | |
| Dividend | |
|---|---|
| Dividend | 0.70 |
| Dividend Yield (Forward) | |
| Financials | |
| Revenue (5 Year Growth) | |
| Revenue (Quarterly YoY Growth) | |
| EPS Diluted (5 Year Growth) | |
| EPS Diluted (Quarterly YoY Growth) | |
| Debt to Equity Ratio | 1.886 |
| Return on Equity | |
| Return on Assets | |
| Risk | |
| Beta (5Y) | |
| Max Drawdown (5Y) | 27.15% |
Profile
| Honeywell International, Inc. is a software industrial company, which offers industry specific solutions to aerospace and automotive products and services. It operates through the following business segments: Aerospace Technologies, Industrial Automation, Building Automation, Energy and Sustainability Solutions, and Corporate and All Other. The company was founded by Albert M. Butz in 1906 and is headquartered in Charlotte, NC. |
| URL | http://www.honeywell.com |
| Investor Relations URL | https://honeywell.gcs-web.com/investor-relations |
| HQ State/Province | North Carolina |
| Sector | Industrials |
| Industry | Industrial Conglomerates |
| Equity Style | Mid Cap Core |
| Next Earnings Release | Oct. 22, 2026 (est.) |
| Last Earnings Release | Jul. 23, 2026 |
| Next Ex-Dividend Date | Aug. 14, 2026 |
| Last Ex-Dividend Date | May. 15, 2026 |