

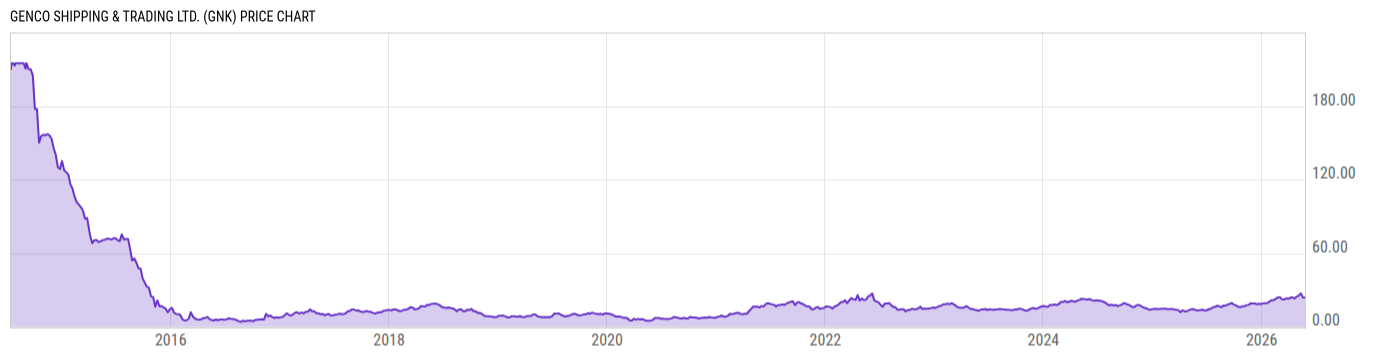
Genco Shipping & Trading Ltd. (GNK)
23.60
+0.21
(+0.90%)
USD |
NYSE |
May 26, 16:00
23.59
-0.01
(-0.04%)
Pre-Market: 20:00
Price Chart
Key Stats
| Price and Performance | |
|---|---|
| Market Cap | 1.028B |
| 52 Week High (Daily) | |
| 52 Week Low (Daily) | |
| All-Time High (Daily) | |
| Year to Date Total Returns (Daily) | |
| 1 Month Total Returns (Daily) | |
| 1 Year Total Returns (Daily) | 87.97% |
| Valuation | |
| PE Ratio | 62.55 |
| PE Ratio (Forward) | |
| PS Ratio | 2.686 |
| Price to Book Value | 1.162 |
| EV to EBITDA | |
| Dividend | |
|---|---|
| Dividend | 0.35 |
| Dividend Yield (Forward) | |
| Financials | |
| Revenue (5 Year Growth) | |
| Revenue (Quarterly YoY Growth) | |
| EPS Diluted (5 Year Growth) | |
| EPS Diluted (Quarterly YoY Growth) | |
| Debt to Equity Ratio | 0.3665 |
| Return on Equity | |
| Return on Assets | |
| Risk | |
| Beta (5Y) | |
| Max Drawdown (5Y) | 53.83% |
Profile
| Genco Shipping & Trading Ltd. is an international ship owning company, which engages in the transportation of iron ore, coal, grain, bauxite, steel products, and other drybulk cargoes. It operates through the Major Bulk and Minor Bulk segments. The Major Bulk segment focuses on Capesize vessels. The Minor Bulk segment consists of Ultramax and Supramax vessels. The company was founded on September 27, 2004 and is headquartered in New York, NY. |
| URL | http://www.gencoshipping.com |
| Investor Relations URL | https://investors.gencoshipping.com/ |
| HQ State/Province | New York |
| Sector | Industrials |
| Industry | Marine Transportation |
| Next Earnings Release | Aug. 05, 2026 (est.) |
| Last Earnings Release | May. 06, 2026 |
| Next Ex-Dividend Date | N/A |
| Last Ex-Dividend Date | May. 18, 2026 |