

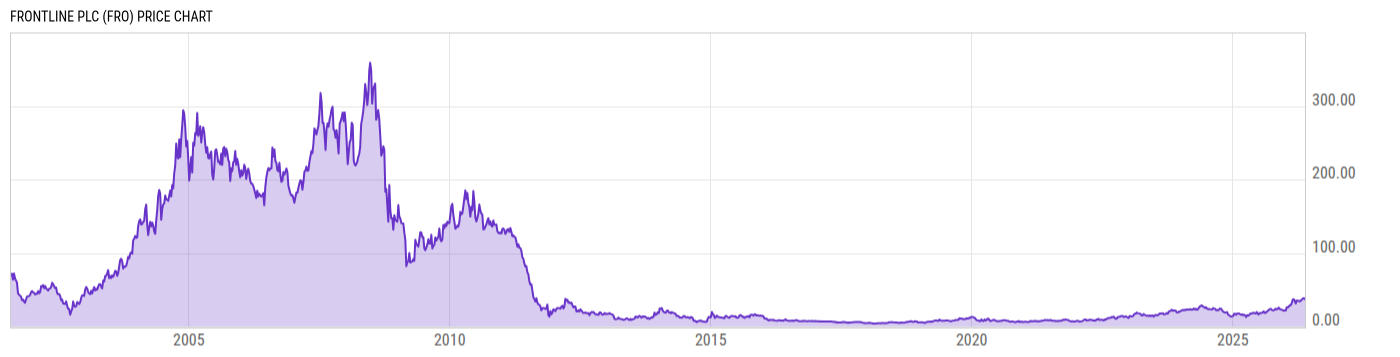
Frontline Plc (FRO)
35.17
+1.01
(+2.96%)
USD |
NYSE |
Jun 05, 16:00
35.05
-0.12
(-0.34%)
After-Hours: 20:00
Price Chart
Key Stats
| Price and Performance | |
|---|---|
| Market Cap | 7.830B |
| 52 Week High (Daily) | |
| 52 Week Low (Daily) | |
| All-Time High (Daily) | |
| Year to Date Total Returns (Daily) | |
| 1 Month Total Returns (Daily) | |
| 1 Year Total Returns (Daily) | 107.3% |
| Valuation | |
| PE Ratio | 8.652 |
| PE Ratio (Forward) | |
| PS Ratio | 3.478 |
| Price to Book Value | 2.756 |
| EV to EBITDA | |
| Dividend | |
|---|---|
| Dividend | 1.55 |
| Dividend Yield (Forward) | |
| Financials | |
| Revenue (5 Year Growth) | |
| Revenue (Quarterly YoY Growth) | |
| EPS Diluted (5 Year Growth) | |
| EPS Diluted (Quarterly YoY Growth) | |
| Debt to Equity Ratio | 0.926 |
| Return on Equity | |
| Return on Assets | |
| Risk | |
| Beta (5Y) | |
| Max Drawdown (5Y) | 51.97% |
Profile
| Frontline Plc is an international shipping company, which engages in the ownership and operation of oil and product tankers. It also offers the seaborne transportation of crude oil and oil products. The company was founded in 1985 and is headquartered in Limmasol, Cyprus. |
| URL | http://www.frontlineplc.cy |
| Investor Relations URL | https://www.frontline.bm/investor-relations/ |
| HQ State/Province | Limassol |
| Sector | Energy |
| Industry | Oil, Gas & Consumable Fuels |
| Next Earnings Release | Aug. 31, 2026 (est.) |
| Last Earnings Release | May. 22, 2026 |
| Next Ex-Dividend Date | Jun. 12, 2026 |
| Last Ex-Dividend Date | Mar. 12, 2026 |