

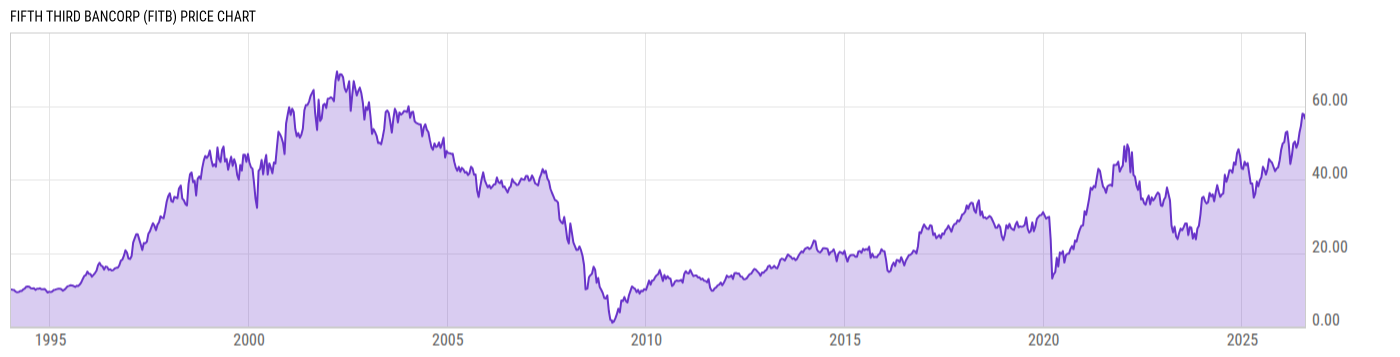
Fifth Third Bancorp (FITB)
56.59
+0.02
(+0.04%)
USD |
NYSE |
Jul 30, 16:00
56.60
+0.01
(+0.02%)
After-Hours: 20:00
Price Chart
Key Stats
| Price and Performance | |
|---|---|
| Market Cap | 51.30B |
| 52 Week High (Daily) | |
| 52 Week Low (Daily) | |
| All-Time High (Daily) | |
| Year to Date Total Returns (Daily) | |
| 1 Month Total Returns (Daily) | |
| 1 Year Total Returns (Daily) | 38.55% |
| Valuation | |
| PE Ratio | 19.26 |
| PE Ratio (Forward) | |
| PS Ratio | 2.852 |
| Price to Book Value | 1.591 |
| EV to EBITDA | |
| Dividend | |
|---|---|
| Dividend | 0.40 |
| Dividend Yield (Forward) | |
| Financials | |
| Revenue (5 Year Growth) | |
| Revenue (Quarterly YoY Growth) | |
| EPS Diluted (5 Year Growth) | |
| EPS Diluted (Quarterly YoY Growth) | |
| Debt to Equity Ratio | 0.6469 |
| Return on Equity | |
| Return on Assets | |
| Risk | |
| Beta (5Y) | |
| Max Drawdown (5Y) | 51.66% |
Profile
| Fifth Third Bancorp is a bank holding company, which engages in the provision of diversified financial services. It operates through the following segments: Commercial Banking, Consumer and Small Business Banking, and Wealth and Asset Management. The Commercial Banking segment offers credit intermediation, cash management, and financial services to large and middle-market businesses and government and professional customers. The Consumer and Small Business Banking segment provides a full range of deposit and loan products to individuals and small businesses through a network of full-service banking centers and relationships with indirect and correspondent loan originators in addition to providing products designed to meet the specific needs of small businesses, including cash management services. The Wealth and Asset Management segment provides wealth management solutions for individuals, companies, and not-for-profit organizations including wealth planning, investment management, banking, insurance, trust, and estate services. The company was founded on October 7, 1974 and is headquartered in Cincinnati, OH. |
| URL | http://www.53.com |
| Investor Relations URL | https://ir.53.com/home/default.aspx |
| HQ State/Province | Ohio |
| Sector | Financials |
| Industry | Banks |
| Equity Style | Mid Cap Value |
| Next Earnings Release | Oct. 19, 2026 |
| Last Earnings Release | Jul. 17, 2026 |
| Next Ex-Dividend Date | N/A |
| Last Ex-Dividend Date | Jun. 30, 2026 |