

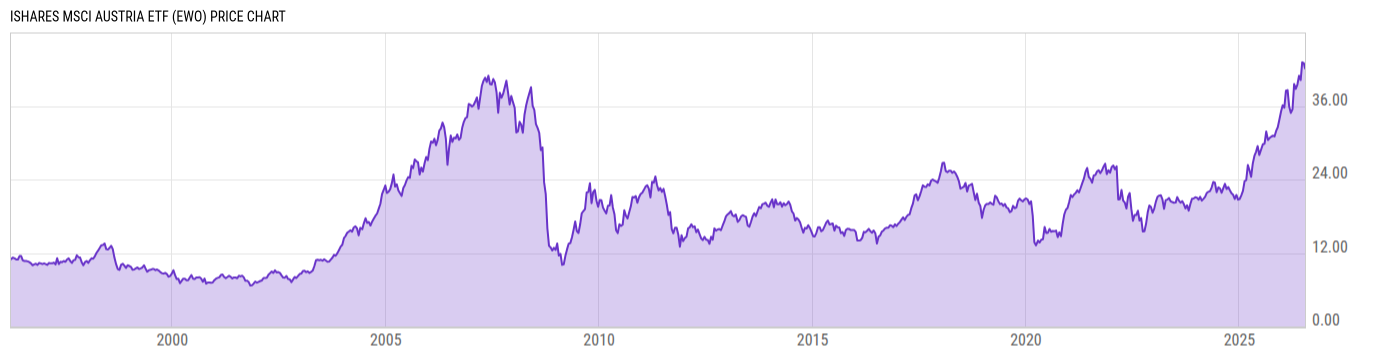
iShares MSCI Austria ETF (EWO)
41.62
-0.10
(-0.25%)
USD |
NYSEARCA |
Jul 20, 14:45
Price Chart
Key Stats
| Net Expense Ratio | Discount or Premium to NAV | Total Assets Under Management | 30-Day Average Daily Volume |
|---|---|---|---|
| 0.49% | 0.34% | 160.08M | 51162.63 |
| Weighted Average Dividend Yield | Turnover Ratio (Generic) | 1 Year Fund Level Flows | Max Drawdown (Since Inception) |
| 2.62% | 24.00% | -12.45M |
Basic Info
| Investment Strategy | |
| The Fund seeks to track the investment results of the MSCI Austria IMI 25/50 Index (the "Underlying Index"), which is a free float-adjusted market capitalization-weighted index that is designed to measure the performance of the large-, mid- and small-capitalization segments of the equity market in Austria. |
| General | |
| Security Type | Exchange-Traded Fund |
| Equity Style | Mid Cap Value |
| Broad Asset Class | International Equity |
| Broad Category | Equity |
| Global Peer Group | Equity Austria |
| Peer Group | European Region Funds |
| Global Macro | Equity Europe |
| US Macro | Developed International Markets Funds |
| YCharts Categorization | -- |
| YCharts Benchmark | -- |
| Prospectus Objective | European Region Funds |
| Fund Owner Firm Name | BlackRock |
| Broad Asset Class Benchmark Index | |
| ^MSACXUSNTR | 100.0% |
Performance Versus Peer Group
Annual Total Returns Versus Peers
As of July 20, 2026.
Asset Allocation
As of June 30, 2026.
| Type | % Net |
|---|---|
| Cash | 0.15% |
| Stock | 98.69% |
| Bond | 0.02% |
| Convertible | 0.00% |
| Preferred | 0.00% |
| Other | 1.14% |
Basic Info
| Investment Strategy | |
| The Fund seeks to track the investment results of the MSCI Austria IMI 25/50 Index (the "Underlying Index"), which is a free float-adjusted market capitalization-weighted index that is designed to measure the performance of the large-, mid- and small-capitalization segments of the equity market in Austria. |
| General | |
| Security Type | Exchange-Traded Fund |
| Equity Style | Mid Cap Value |
| Broad Asset Class | International Equity |
| Broad Category | Equity |
| Global Peer Group | Equity Austria |
| Peer Group | European Region Funds |
| Global Macro | Equity Europe |
| US Macro | Developed International Markets Funds |
| YCharts Categorization | -- |
| YCharts Benchmark | -- |
| Prospectus Objective | European Region Funds |
| Fund Owner Firm Name | BlackRock |
| Broad Asset Class Benchmark Index | |
| ^MSACXUSNTR | 100.0% |