

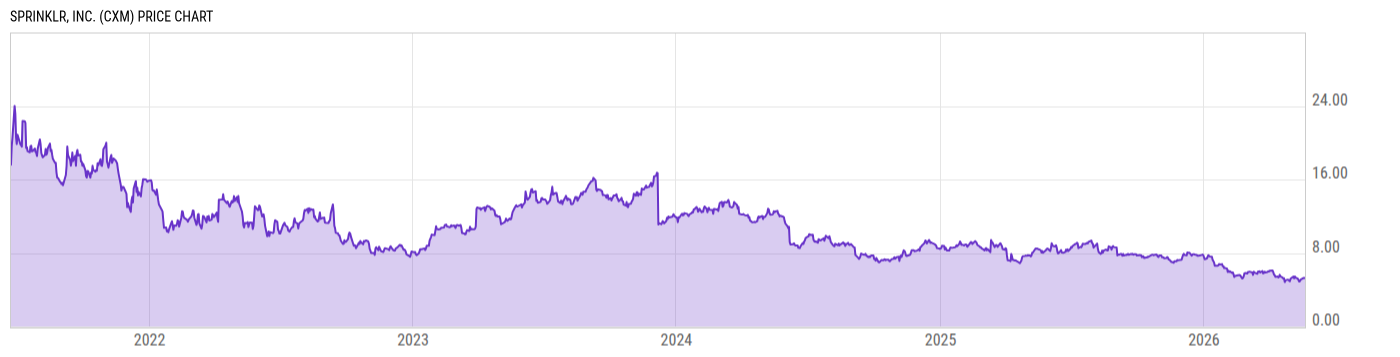
Sprinklr, Inc. (CXM)
5.40
0.00 (0.00%)
USD |
NYSE |
Jun 09, 09:46
Price Chart
Key Stats
| Price and Performance | |
|---|---|
| Market Cap | 1.264B |
| 52 Week High (Daily) | |
| 52 Week Low (Daily) | |
| All-Time High (Daily) | |
| Year to Date Total Returns (Daily) | |
| 1 Month Total Returns (Daily) | |
| 1 Year Total Returns (Daily) | -38.36% |
| Valuation | |
| PE Ratio | 48.21 |
| PE Ratio (Forward) | |
| PS Ratio | 1.567 |
| Price to Book Value | 2.587 |
| EV to EBITDA | |
| Dividend | |
|---|---|
| Dividend | -- |
| Dividend Yield (Forward) | |
| Financials | |
| Revenue (5 Year Growth) | |
| Revenue (Quarterly YoY Growth) | |
| EPS Diluted (5 Year Growth) | |
| EPS Diluted (Quarterly YoY Growth) | |
| Debt to Equity Ratio | 0.0897 |
| Return on Equity | |
| Return on Assets | |
| Risk | |
| Beta (5Y) | |
| Max Drawdown (5Y) | -- |
Profile
| Sprinklr, Inc. engages in the provision of enterprise cloud software products. It enables organizations to do marketing, advertising, research, care, sales, and engagement across modern channels including social, messaging, chat, and text through its unified customer experience management software platform. The company was founded by Ragy Thomas on September 24, 2009 and is headquartered in New York, NY. |
| URL | http://www.sprinklr.com |
| Investor Relations URL | https://investors.sprinklr.com/ |
| HQ State/Province | New York |
| Sector | Information Technology |
| Industry | Software |
| Next Earnings Release | Sep. 02, 2026 (est.) |
| Last Earnings Release | Jun. 03, 2026 |
| Next Ex-Dividend Date | N/A |
| Last Ex-Dividend Date | N/A |