

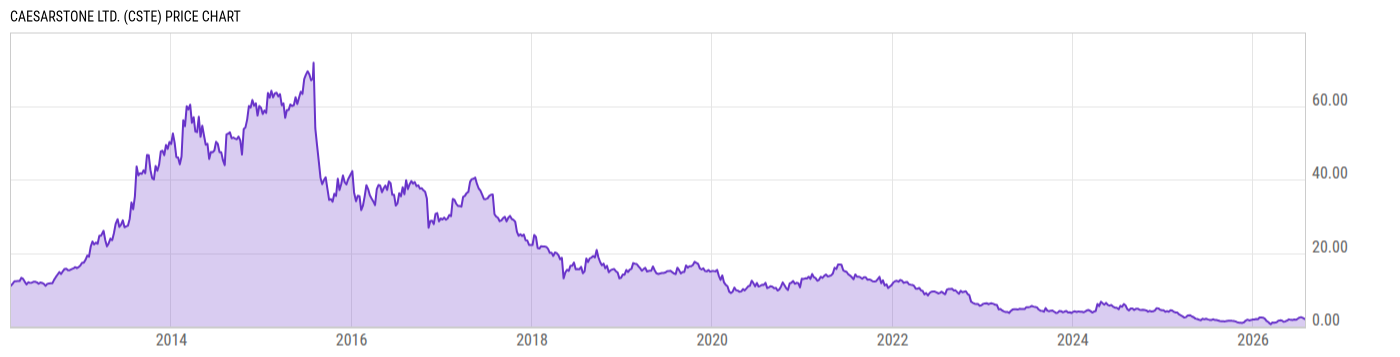
Caesarstone Ltd. (CSTE)
2.05
+0.04
(+1.99%)
USD |
NASDAQ |
Jul 30, 16:00
2.05
0.00 (0.00%)
After-Hours: 17:50
Price Chart
Key Stats
| Price and Performance | |
|---|---|
| Market Cap | 70.88M |
| 52 Week High (Daily) | |
| 52 Week Low (Daily) | |
| All-Time High (Daily) | |
| Year to Date Total Returns (Daily) | |
| 1 Month Total Returns (Daily) | |
| 1 Year Total Returns (Daily) | 11.67% |
| Valuation | |
| PE Ratio | -- |
| PE Ratio (Forward) | |
| PS Ratio | 0.1834 |
| Price to Book Value | 0.5992 |
| EV to EBITDA | |
| Dividend | |
|---|---|
| Dividend | -- |
| Dividend Yield (Forward) | |
| Financials | |
| Revenue (5 Year Growth) | |
| Revenue (Quarterly YoY Growth) | |
| EPS Diluted (5 Year Growth) | |
| EPS Diluted (Quarterly YoY Growth) | |
| Debt to Equity Ratio | 0.8892 |
| Return on Equity | |
| Return on Assets | |
| Risk | |
| Beta (5Y) | |
| Max Drawdown (5Y) | 96.27% |
Profile
| Caesarstone Ltd. operates as a multi material designer, producer and reseller of countertops used in residential and commercial buildings globally. It designs, develops, produces and source engineered quartz, natural stone and porcelain products that offer aesthetic appeal and functionality through a distinct variety of colors, styles, textures, and finishes used primarily as countertops, vanities, and other interior and exterior spaces. The company was founded in 1987 and is headquartered in Haifa, Israel. |
| URL | http://www.caesarstone.co.il |
| Investor Relations URL | https://ir.caesarstone.com |
| HQ State/Province | Haifa |
| Sector | Industrials |
| Industry | Building Products |
| Equity Style | Small Cap Value |
| Next Earnings Release | Aug. 05, 2026 |
| Last Earnings Release | May. 13, 2026 |
| Next Ex-Dividend Date | N/A |
| Last Ex-Dividend Date | Aug. 16, 2022 |