

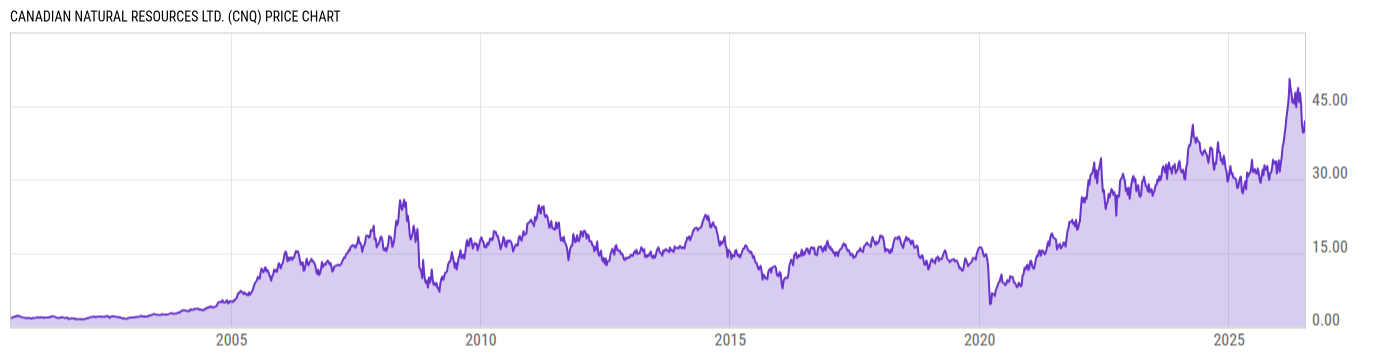
Canadian Natural Resources Ltd. (CNQ)
41.81
-0.07
(-0.17%)
USD |
NYSE |
Jul 10, 16:00
41.78
-0.03
(-0.07%)
After-Hours: 20:00
Price Chart
Key Stats
| Price and Performance | |
|---|---|
| Market Cap | 87.20B |
| 52 Week High (Daily) | |
| 52 Week Low (Daily) | |
| All-Time High (Daily) | |
| Year to Date Total Returns (Daily) | |
| 1 Month Total Returns (Daily) | |
| 1 Year Total Returns (Daily) | 37.76% |
| Valuation | |
| PE Ratio | 12.51 |
| PE Ratio (Forward) | |
| PS Ratio | 3.132 |
| Price to Book Value | 2.726 |
| EV to EBITDA | |
| Dividend | |
|---|---|
| Dividend | 0.4460 |
| Dividend Yield (Forward) | |
| Financials | |
| Revenue (5 Year Growth) | |
| Revenue (Quarterly YoY Growth) | |
| EPS Diluted (5 Year Growth) | |
| EPS Diluted (Quarterly YoY Growth) | |
| Debt to Equity Ratio | 0.4485 |
| Return on Equity | |
| Return on Assets | |
| Risk | |
| Beta (5Y) | |
| Max Drawdown (5Y) | 35.84% |
Profile
| Canadian Natural Resources Ltd. is an oil and natural gas production company, which engages in the exploration, development, marketing, and production of crude oil and natural gas. It operates through the following segments: Oil Sands Mining & Upgrading, Midstream & Refining, and Exploration & Production. The Oil Sands Mining & Upgrading segment produces synthetic crude oil through bitumen mining and upgrading operations. The Midstream & Refining segment focuses on maintaining pipeline operations and investment. The Exploration & Production segment consists of operations in North America, largely in Western Canada, the United Kingdom portion of the North Sea, and Côte d’Ivoire and South Africa in Africa. The company was founded on November 7, 1973 and is headquartered in Calgary, Canada. |
| URL | http://www.cnrl.com |
| Investor Relations URL | https://www.cnrl.com/#investors |
| HQ State/Province | Alberta |
| Sector | Energy |
| Industry | Oil, Gas & Consumable Fuels |
| Equity Style | Large Cap Value |
| Next Earnings Release | Aug. 06, 2026 |
| Last Earnings Release | May. 07, 2026 |
| Next Ex-Dividend Date | N/A |
| Last Ex-Dividend Date | Jun. 23, 2026 |