

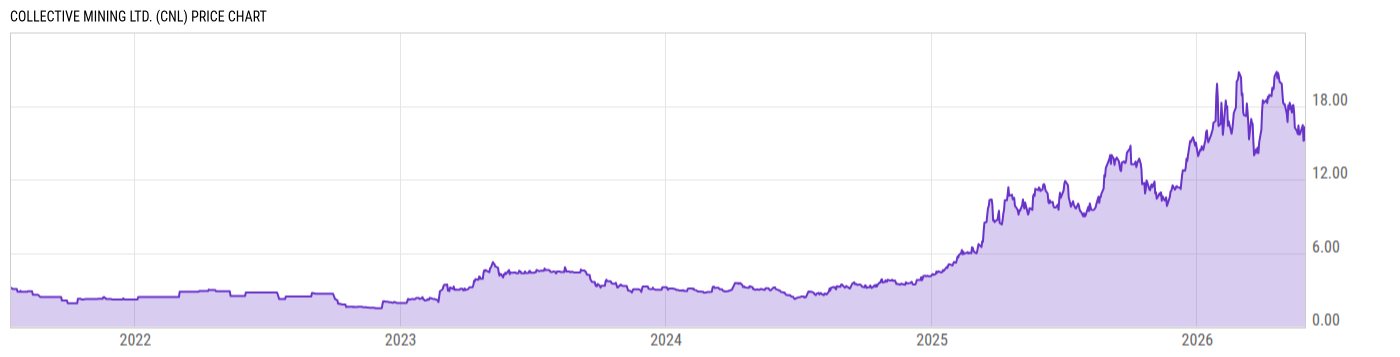
Collective Mining Ltd. (CNL)
16.28
+1.06
(+6.96%)
USD |
NYAM |
May 29, 16:00
16.22
-0.06
(-0.37%)
After-Hours: 20:00
Price Chart
Key Stats
| Price and Performance | |
|---|---|
| Market Cap | 1.510B |
| 52 Week High (Daily) | |
| 52 Week Low (Daily) | |
| All-Time High (Daily) | |
| Year to Date Total Returns (Daily) | |
| 1 Month Total Returns (Daily) | |
| 1 Year Total Returns (Daily) | 44.33% |
| Valuation | |
| PE Ratio | -- |
| PE Ratio (Forward) | |
| PS Ratio | -- |
| Price to Book Value | 11.24 |
| EV to EBITDA | |
| Dividend | |
|---|---|
| Dividend | -- |
| Dividend Yield (Forward) | |
| Financials | |
| Revenue (5 Year Growth) | |
| Revenue (Quarterly YoY Growth) | |
| EPS Diluted (5 Year Growth) | |
| EPS Diluted (Quarterly YoY Growth) | |
| Debt to Equity Ratio | 0.3319 |
| Return on Equity | |
| Return on Assets | |
| Risk | |
| Beta (5Y) | |
| Max Drawdown (5Y) | -- |
Profile
| Collective Mining Ltd. engages in the acquisition, exploration, and development of mineral properties in South America. It holds interests in San Antonio and Guayabales projects. The company was founded on February 21, 2018 and is headquartered in Toronto, Canada. |
| URL | http://www.collectivemining.com |
| Investor Relations URL | https://collectivemining.com/investors/ |
| HQ State/Province | Ontario |
| Sector | Materials |
| Industry | Metals & Mining |
| Next Earnings Release | N/A |
| Last Earnings Release | Apr. 28, 2016 |
| Next Ex-Dividend Date | N/A |
| Last Ex-Dividend Date | N/A |