

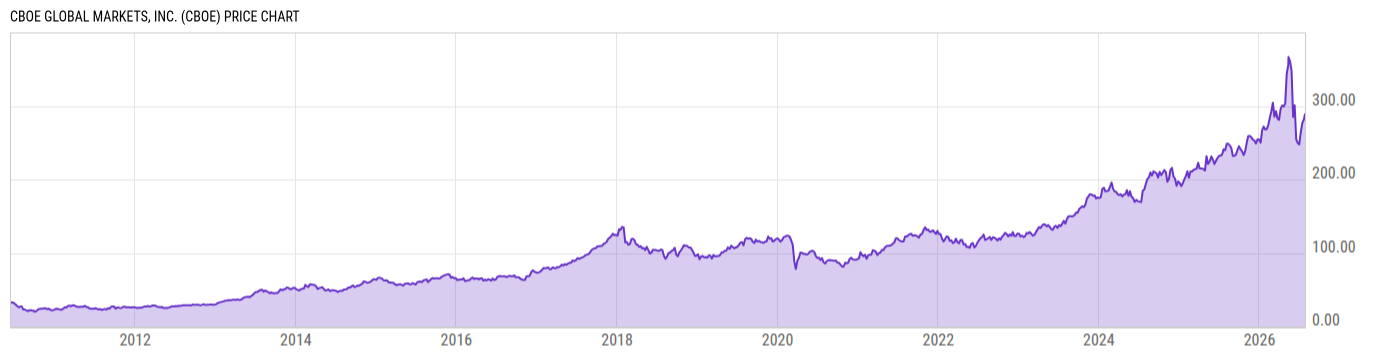
Cboe Global Markets, Inc. (CBOE)
288.87
+3.80
(+1.33%)
USD |
BATS |
Jul 27, 16:00
290.93
+2.06
(+0.71%)
Pre-Market: 07:15
Price Chart
Key Stats
| Price and Performance | |
|---|---|
| Market Cap | 30.24B |
| 52 Week High (Daily) | |
| 52 Week Low (Daily) | |
| All-Time High (Daily) | |
| Year to Date Total Returns (Daily) | |
| 1 Month Total Returns (Daily) | |
| 1 Year Total Returns (Daily) | 18.41% |
| Valuation | |
| PE Ratio | 24.66 |
| PE Ratio (Forward) | |
| PS Ratio | 6.328 |
| Price to Book Value | 5.627 |
| EV to EBITDA | |
| Dividend | |
|---|---|
| Dividend | 0.72 |
| Dividend Yield (Forward) | |
| Financials | |
| Revenue (5 Year Growth) | |
| Revenue (Quarterly YoY Growth) | |
| EPS Diluted (5 Year Growth) | |
| EPS Diluted (Quarterly YoY Growth) | |
| Debt to Equity Ratio | 0.2949 |
| Return on Equity | |
| Return on Assets | |
| Risk | |
| Beta (5Y) | |
| Max Drawdown (5Y) | 36.73% |
Profile
| Cboe Global Markets, Inc. engages in the provision of trading and investment solutions to investors. It operates through the following business segments: Options, North American Equities, Futures, Europe and Asia Pacific, Global FX, and Digital. The Options segment includes the options exchange business, which lists trading options on market indexes and on non-exclusive multiply listed options. The North American Equities segment covers listed cash equities and ETP transaction services that occur on BZX, BYX, EDGX, and EDGA. The Futures segment refers to the business of futures exchange, CFE, which includes offering for trading futures on the VIX Index and bitcoin and other futures products. The Europe and Asia Pacific segment relates to the pan-European listed cash equities transaction services, ETPs, exchange-traded commodities, and international depository receipts that occur on the RIE, operated by Cboe Europe Equities. The Global FX segment represents the institutional FX trading services that occur on the Cboe FX platform. The Digital segment focuses on Cboe Digital, which operates a digital asset spot market and a regulated futures exchange. The company was founded in 1973 and is headquartered in Chicago, IL. |
| URL | http://www.cboe.com |
| Investor Relations URL | https://ir.cboe.com/ |
| HQ State/Province | Illinois |
| Sector | Financials |
| Industry | Capital Markets |
| Equity Style | Mid Cap Core |
| Next Earnings Release | Jul. 31, 2026 |
| Last Earnings Release | May. 01, 2026 |
| Next Ex-Dividend Date | N/A |
| Last Ex-Dividend Date | May. 29, 2026 |