

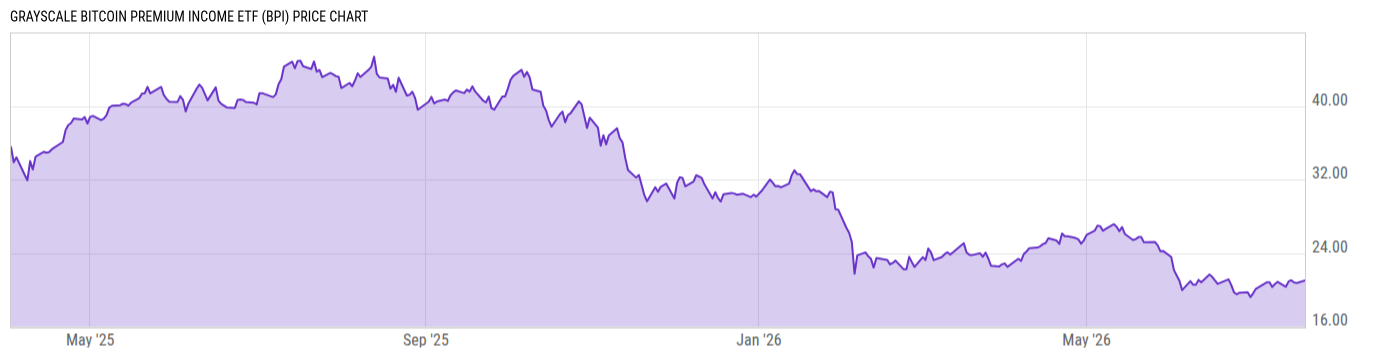
Grayscale Bitcoin Premium Income ETF (BPI)
21.01
+0.27
(+1.29%)
USD |
NYSEARCA |
Jul 20, 16:00
21.00
-0.01
(-0.05%)
After-Hours: 20:00
Price Chart
Key Stats
| Net Expense Ratio | Discount or Premium to NAV | Total Assets Under Management | 30-Day Average Daily Volume |
|---|---|---|---|
| 0.65% | 0.29% | 3.142M | 2400.63 |
| Weighted Average Dividend Yield | Turnover Ratio (Generic) | 1 Year Fund Level Flows | Max Drawdown (Since Inception) |
| -- | -- | 1.047M |
Basic Info
| Investment Strategy | |
| The Fund seeks to provide current income while maintaining prospects for capital appreciation through the use of options on Bitcoin exchange-traded products whose investment objectives are to track the price performance of Bitcoin. Investing in options contracts that utilize a Bitcoin ETP as the reference asset. |
| General | |
| Security Type | Exchange-Traded Fund |
| Equity Style | -- |
| Broad Asset Class | Miscellaneous |
| Broad Category | Alternative Strategies |
| Global Peer Group | Alternative Relative Value |
| Peer Group | Option Income Strategies Funds |
| Global Macro | Liquid Alternatives |
| US Macro | -- |
| YCharts Categorization | -- |
| YCharts Benchmark | -- |
| Prospectus Objective | -- |
| Fund Owner Firm Name | Grayscale |
| Broad Asset Class Benchmark Index | |
| ^SPXTR | 100.0% |
Performance Versus Peer Group
Annual Total Returns Versus Peers
As of July 21, 2026.
Asset Allocation
As of June 30, 2026.
| Type | % Net |
|---|---|
| Cash | 0.36% |
| Stock | 0.00% |
| Bond | 82.97% |
| Convertible | 0.00% |
| Preferred | 0.00% |
| Other | 16.67% |
Basic Info
| Investment Strategy | |
| The Fund seeks to provide current income while maintaining prospects for capital appreciation through the use of options on Bitcoin exchange-traded products whose investment objectives are to track the price performance of Bitcoin. Investing in options contracts that utilize a Bitcoin ETP as the reference asset. |
| General | |
| Security Type | Exchange-Traded Fund |
| Equity Style | -- |
| Broad Asset Class | Miscellaneous |
| Broad Category | Alternative Strategies |
| Global Peer Group | Alternative Relative Value |
| Peer Group | Option Income Strategies Funds |
| Global Macro | Liquid Alternatives |
| US Macro | -- |
| YCharts Categorization | -- |
| YCharts Benchmark | -- |
| Prospectus Objective | -- |
| Fund Owner Firm Name | Grayscale |
| Broad Asset Class Benchmark Index | |
| ^SPXTR | 100.0% |