

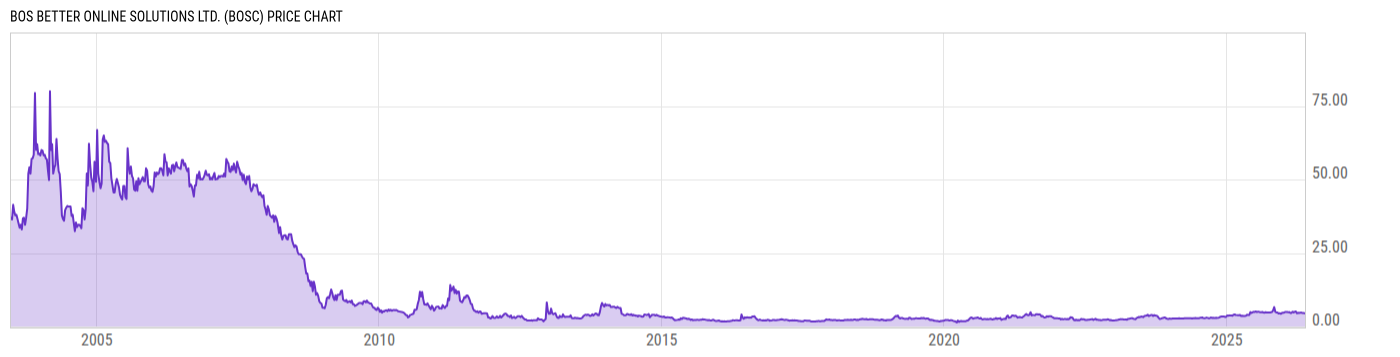
BOS Better Online Solutions Ltd. (BOSC)
4.21
-0.02
(-0.47%)
USD |
NASDAQ |
Jun 09, 12:12
Price Chart
Key Stats
| Price and Performance | |
|---|---|
| Market Cap | 29.68M |
| 52 Week High (Daily) | |
| 52 Week Low (Daily) | |
| All-Time High (Daily) | |
| Year to Date Total Returns (Daily) | |
| 1 Month Total Returns (Daily) | |
| 1 Year Total Returns (Daily) | -6.00% |
| Valuation | |
| PE Ratio | 9.408 |
| PE Ratio (Forward) | |
| PS Ratio | 0.6073 |
| Price to Book Value | 1.007 |
| EV to EBITDA | |
| Dividend | |
|---|---|
| Dividend | -- |
| Dividend Yield (Forward) | |
| Financials | |
| Revenue (5 Year Growth) | |
| Revenue (Quarterly YoY Growth) | |
| EPS Diluted (5 Year Growth) | |
| EPS Diluted (Quarterly YoY Growth) | |
| Debt to Equity Ratio | 0.0695 |
| Return on Equity | |
| Return on Assets | |
| Risk | |
| Beta (5Y) | |
| Max Drawdown (5Y) | 59.35% |
Profile
| BOS Better Online Solutions Ltd. provides intelligent robotics and supply chain solutions to enterprises. It offers smart automation systems for industrial processes, logistics and retail stores. The firm operates through the following segments: Intelligent Robotics, Radio Frequency Identification (RFID), and Supply Chain Solutions. The company was founded by Israel Gal in 1990 and is headquartered in Rishon LeZion, Israel. |
| URL | http://www.boscom.com |
| Investor Relations URL | http://www.boscorporate.com/?CategoryID=159 |
| HQ State/Province | Tel Aviv |
| Sector | Information Technology |
| Industry | Communications Equipment |
| Next Earnings Release | Aug. 20, 2026 (est.) |
| Last Earnings Release | May. 28, 2026 |
| Next Ex-Dividend Date | N/A |
| Last Ex-Dividend Date | N/A |