

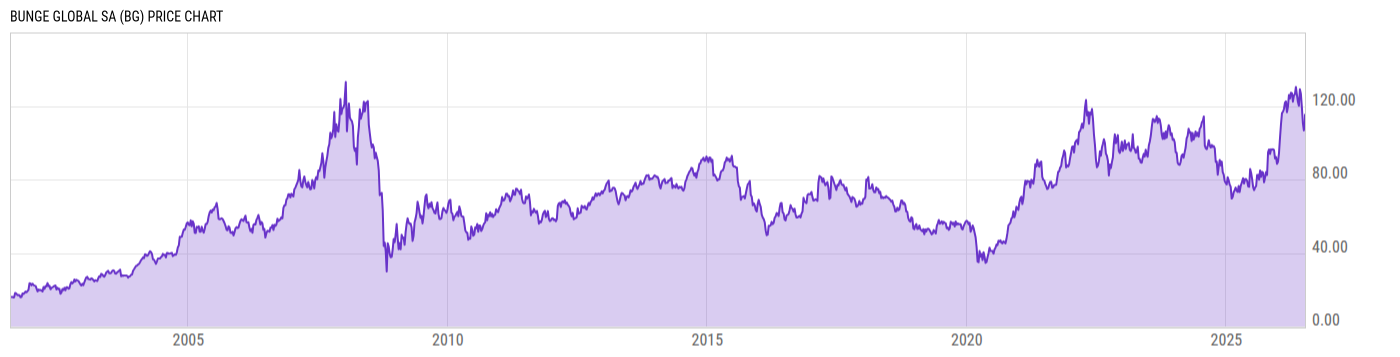
Bunge Global SA (BG)
115.27
+4.36
(+3.93%)
USD |
NYSE |
Jul 08, 16:00
115.05
-0.22
(-0.19%)
After-Hours: 20:00
Price Chart
Key Stats
| Price and Performance | |
|---|---|
| Market Cap | 22.36B |
| 52 Week High (Daily) | |
| 52 Week Low (Daily) | |
| All-Time High (Daily) | |
| Year to Date Total Returns (Daily) | |
| 1 Month Total Returns (Daily) | |
| 1 Year Total Returns (Daily) | 52.36% |
| Valuation | |
| PE Ratio | 26.83 |
| PE Ratio (Forward) | |
| PS Ratio | 0.2593 |
| Price to Book Value | 1.394 |
| EV to EBITDA | |
| Dividend | |
|---|---|
| Dividend | 0.72 |
| Dividend Yield (Forward) | |
| Financials | |
| Revenue (5 Year Growth) | |
| Revenue (Quarterly YoY Growth) | |
| EPS Diluted (5 Year Growth) | |
| EPS Diluted (Quarterly YoY Growth) | |
| Debt to Equity Ratio | 1.015 |
| Return on Equity | |
| Return on Assets | |
| Risk | |
| Beta (5Y) | |
| Max Drawdown (5Y) | 41.51% |
Profile
| Bunge Global SA engages in agribusiness including food and ingredients. It operates through the following segments: Agribusiness, Refined & Specialty Oils, Milling, Sugar & Bioenergy, and Corporate & Other. The Agribusiness segment is an integrated, global business principally involved in the purchase, storage, transportation, processing and sale of agricultural commodities and commodity products. The Refined & Specialty Oils segment includes businesses that sell vegetable oils and fats, including cooking oils, shortenings, specialty ingredients, and renewable diesel feedstocks. The Milling segment refers to the businesses that sell wheat flours, bakery mixes, and corn-based products. The Sugar & Bioenergy segment consists of results from the company’s previously owned 50% ownership interest in BP Bunge Bioenergia. The Corporate & Other segment focuses on the salaries and overhead for corporate functions that are not allocated to individual reporting segments because the operating performance of such reporting segments is evaluated. It connects farmers to consumers to deliver essential and sustainable food, feed and fuel. The company was founded on February 14, 2023 and is headquartered in Chesterfield, MO. |
| URL | http://www.bunge.com |
| Investor Relations URL | https://investors.bunge.com |
| HQ State/Province | Missouri |
| Sector | Consumer Staples |
| Industry | Food Products |
| Equity Style | Small Cap Value |
| Next Earnings Release | Jul. 29, 2026 |
| Last Earnings Release | Apr. 29, 2026 |
| Next Ex-Dividend Date | Aug. 18, 2026 |
| Last Ex-Dividend Date | May. 22, 2026 |