

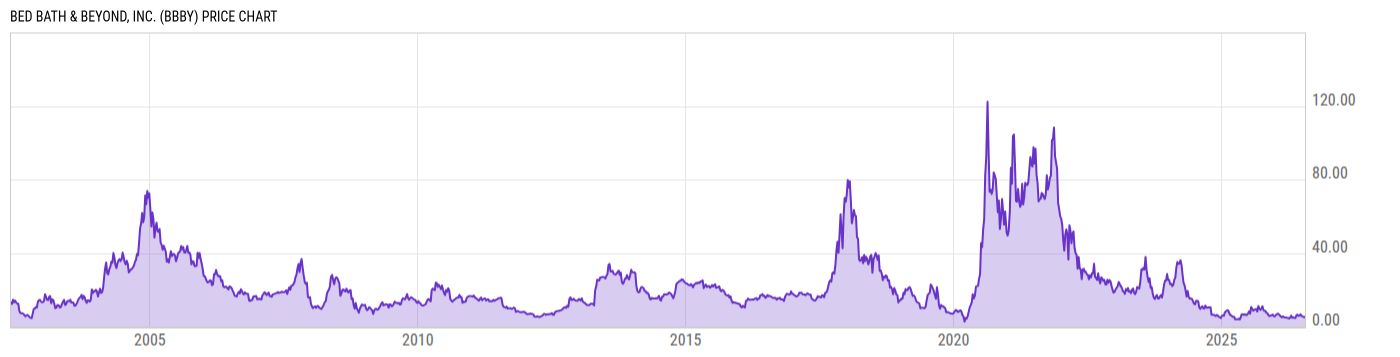
Bed Bath & Beyond, Inc. (BBBY)
5.37
+0.41
(+8.27%)
USD |
NYSE |
Jul 27, 16:00
5.33
-0.04
(-0.74%)
Pre-Market: 07:02
Price Chart
Key Stats
| Price and Performance | |
|---|---|
| Market Cap | 372.44M |
| 52 Week High (Daily) | |
| 52 Week Low (Daily) | |
| All-Time High (Daily) | |
| Year to Date Total Returns (Daily) | |
| 1 Month Total Returns (Daily) | |
| 1 Year Total Returns (Daily) | -46.78% |
| Valuation | |
| PE Ratio | -- |
| PE Ratio (Forward) | |
| PS Ratio | 0.3237 |
| Price to Book Value | 1.843 |
| EV to EBITDA | |
| Dividend | |
|---|---|
| Dividend | -- |
| Dividend Yield (Forward) | |
| Financials | |
| Revenue (5 Year Growth) | |
| Revenue (Quarterly YoY Growth) | |
| EPS Diluted (5 Year Growth) | |
| EPS Diluted (Quarterly YoY Growth) | |
| Debt to Equity Ratio | 0.1081 |
| Return on Equity | |
| Return on Assets | |
| Risk | |
| Beta (5Y) | |
| Max Drawdown (5Y) | 96.99% |
Profile
| Bed Bath & Beyond, Inc. engages in the provision of an e-commerce platform. It offers furniture and home furnishing products and services. The company was founded on May 5, 1997 and is headquartered in Murray, UT. |
| URL | http://www.beyond.com |
| Investor Relations URL | https://investors.beyond.com/overview/default.aspx |
| HQ State/Province | Utah |
| Sector | Consumer Discretionary |
| Industry | Specialty Retail |
| Equity Style | Small Cap Value |
| Next Earnings Release | Aug. 04, 2026 |
| Last Earnings Release | Apr. 27, 2026 |
| Next Ex-Dividend Date | N/A |
| Last Ex-Dividend Date | N/A |