

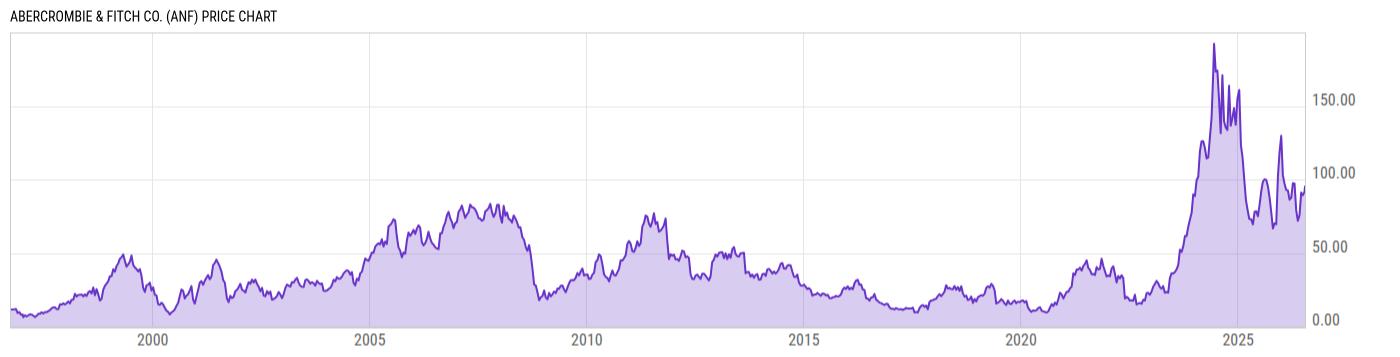
Abercrombie & Fitch Co. (ANF)
95.24
-2.13
(-2.19%)
USD |
NYSE |
Jul 17, 16:00
96.00
+0.76
(+0.80%)
Pre-Market: 09:23
Price Chart
Key Stats
| Price and Performance | |
|---|---|
| Market Cap | 4.232B |
| 52 Week High (Daily) | |
| 52 Week Low (Daily) | |
| All-Time High (Daily) | |
| Year to Date Total Returns (Daily) | |
| 1 Month Total Returns (Daily) | |
| 1 Year Total Returns (Daily) | 1.92% |
| Valuation | |
| PE Ratio | 9.143 |
| PE Ratio (Forward) | |
| PS Ratio | 0.8516 |
| Price to Book Value | 3.158 |
| EV to EBITDA | |
| Dividend | |
|---|---|
| Dividend | -- |
| Dividend Yield (Forward) | |
| Financials | |
| Revenue (5 Year Growth) | |
| Revenue (Quarterly YoY Growth) | |
| EPS Diluted (5 Year Growth) | |
| EPS Diluted (Quarterly YoY Growth) | |
| Debt to Equity Ratio | 0.9645 |
| Return on Equity | |
| Return on Assets | |
| Risk | |
| Beta (5Y) | |
| Max Drawdown (5Y) | 69.93% |
Profile
| Abercrombie & Fitch Co. engages in the retail of apparel, personal care products, and accessories. The firm operates through following geographical segments: Americas, Europe, the Middle East and Africa (EMEA), and Asia-Pacific (APAC). Its brands include Abercrombie and Hollister. The company was founded by David Abercrombie in 1892 and is headquartered in New Albany, OH. |
| URL | http://corporate.abercrombie.com |
| Investor Relations URL | https://corporate.abercrombie.com/investors/ |
| HQ State/Province | Ohio |
| Sector | Consumer Discretionary |
| Industry | Specialty Retail |
| Equity Style | Small Cap Growth |
| Next Earnings Release | Aug. 26, 2026 (est.) |
| Last Earnings Release | May. 27, 2026 |
| Next Ex-Dividend Date | N/A |
| Last Ex-Dividend Date | Mar. 05, 2020 |