

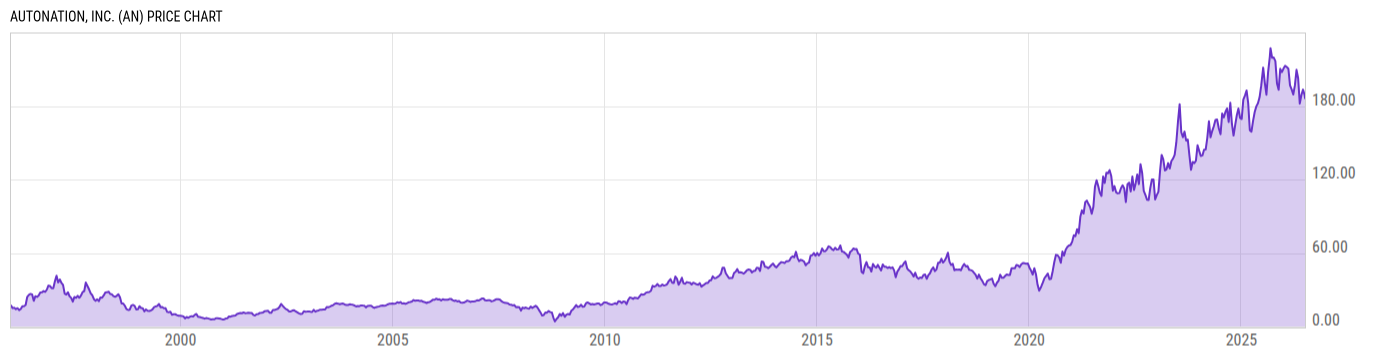
AutoNation, Inc. (AN)
186.41
+2.08
(+1.13%)
USD |
NYSE |
Jul 02, 16:00
186.24
-0.17
(-0.09%)
After-Hours: 20:00
Price Chart
Key Stats
| Price and Performance | |
|---|---|
| Market Cap | 6.322B |
| 52 Week High (Daily) | |
| 52 Week Low (Daily) | |
| All-Time High (Daily) | |
| Year to Date Total Returns (Daily) | |
| 1 Month Total Returns (Daily) | |
| 1 Year Total Returns (Daily) | -12.07% |
| Valuation | |
| PE Ratio | 10.10 |
| PE Ratio (Forward) | |
| PS Ratio | 0.251 |
| Price to Book Value | 2.839 |
| EV to EBITDA | |
| Dividend | |
|---|---|
| Dividend | -- |
| Dividend Yield (Forward) | |
| Financials | |
| Revenue (5 Year Growth) | |
| Revenue (Quarterly YoY Growth) | |
| EPS Diluted (5 Year Growth) | |
| EPS Diluted (Quarterly YoY Growth) | |
| Debt to Equity Ratio | 4.706 |
| Return on Equity | |
| Return on Assets | |
| Risk | |
| Beta (5Y) | |
| Max Drawdown (5Y) | 29.54% |
Profile
| AutoNation, Inc. engages in the provision of automotive products and services. It operates through the following segments: Domestic, Import, Premium Luxury, and Corporate & Other. The Domestic segment consists of retail automotive franchises that sell new vehicles manufactured by General Motors, Ford and Stellantis. The Import segment includes retail automotive franchises that sell new vehicles manufactured primarily by Toyota, Honda, Subaru, and Nissan. The Premium Luxury segment consists of retail automotive franchises that sell new vehicles manufactured primarily by Mercedes-Benz, BMW, Audi, Lexus, and Jaguar Land Rover. The franchises in each segment also sell used vehicles, parts and automotive repair and maintenance services, and automotive finance and insurance products. The Corporate & Other segment consists of other businesses, including collision centers, AutoNation USA used vehicle stores, auction operations, and parts distribution centers. The company was founded by Steven Richard Berrard and Harry Wayne Huizenga Sr. on May 30, 1991 and is headquartered in Fort Lauderdale, FL. |
| URL | http://www.autonation.com |
| Investor Relations URL | https://investors.autonation.com |
| HQ State/Province | Florida |
| Sector | Consumer Discretionary |
| Industry | Specialty Retail |
| Equity Style | Small Cap Core |
| Next Earnings Release | Jul. 31, 2026 (est.) |
| Last Earnings Release | May. 01, 2026 |
| Next Ex-Dividend Date | N/A |
| Last Ex-Dividend Date | N/A |