

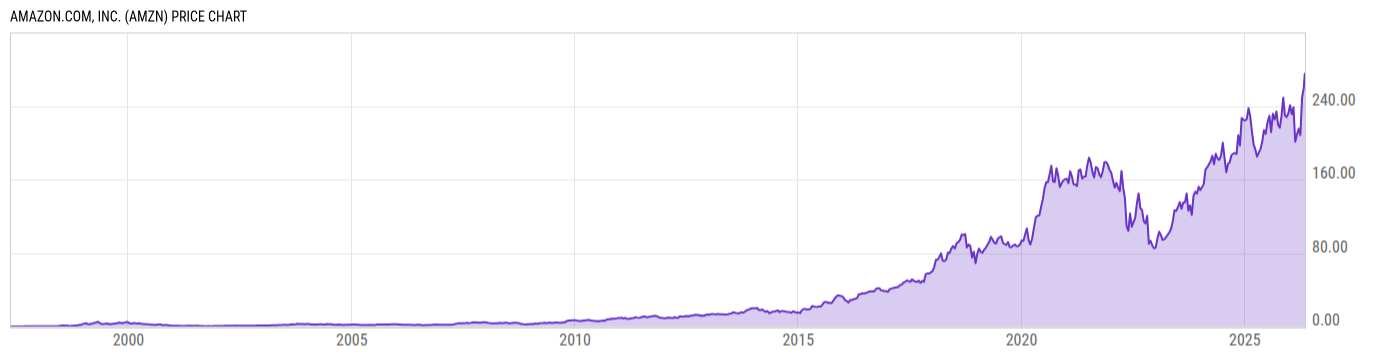
Amazon.com, Inc. (AMZN)
270.64
-3.36
(-1.23%)
USD |
NASDAQ |
May 29, 16:00
270.50
-0.14
(-0.05%)
After-Hours: 20:00
Price Chart
Key Stats
| Price and Performance | |
|---|---|
| Market Cap | 2.911T |
| 52 Week High (Daily) | |
| 52 Week Low (Daily) | |
| All-Time High (Daily) | |
| Year to Date Total Returns (Daily) | |
| 1 Month Total Returns (Daily) | |
| 1 Year Total Returns (Daily) | 31.57% |
| Valuation | |
| PE Ratio | 32.34 |
| PE Ratio (Forward) | |
| PS Ratio | 3.952 |
| Price to Book Value | 6.588 |
| EV to EBITDA | |
| Dividend | |
|---|---|
| Dividend | -- |
| Dividend Yield (Forward) | |
| Financials | |
| Revenue (5 Year Growth) | |
| Revenue (Quarterly YoY Growth) | |
| EPS Diluted (5 Year Growth) | |
| EPS Diluted (Quarterly YoY Growth) | |
| Debt to Equity Ratio | 0.5133 |
| Return on Equity | |
| Return on Assets | |
| Risk | |
| Beta (5Y) | |
| Max Drawdown (5Y) | 56.15% |
Profile
| Amazon.com, Inc. is a multinational technology company, which engages in the provision of online retail shopping services. It operates through the following segments: North America, International, and Amazon Web Services (AWS). The North America segment offers retail sale of consumer products, including from sellers, advertising, and subscriptions services through North America-focused online and physical stores. The International segment focuses on retail sale of consumer products, including sellers, advertising, and subscription services through internationally focused online stores. The AWS segment is composed of global sales of computers, storage, databases, and other services for start-ups, enterprises, government agencies, and academic institutions. The company was founded by Jeffrey P. Bezos in July 1994 and is headquartered in Seattle, WA. |
| URL | http://www.aboutamazon.com |
| Investor Relations URL | https://ir.aboutamazon.com/overview/default.aspx |
| HQ State/Province | Washington |
| Sector | Consumer Discretionary |
| Industry | Broadline Retail |
| Next Earnings Release | Jul. 30, 2026 (est.) |
| Last Earnings Release | Apr. 29, 2026 |
| Next Ex-Dividend Date | N/A |
| Last Ex-Dividend Date | N/A |