

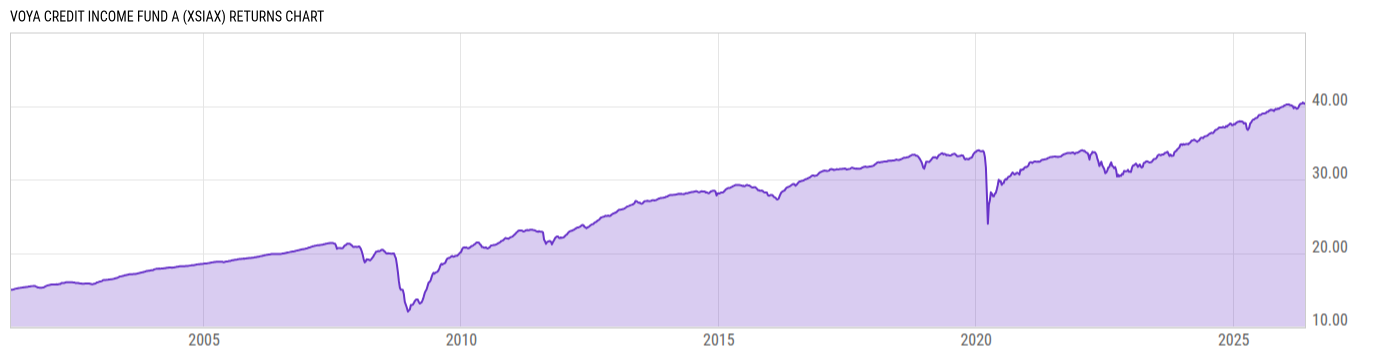
Voya Credit Income Fund A (XSIAX)
9.25
+0.01
(+0.11%)
USD |
May 22 2026
Returns Chart
Key Stats
| Net Expense Ratio | Total Assets Under Management | Weighted Average Dividend Yield | Turnover Ratio (Generic) |
|---|---|---|---|
| 3.60% | 89.34M | -- | 81.00% |
| 1 Year Fund Level Flows | 1 Year Total Returns (Daily) | Annualized Total Returns Since Inception (Daily) | Max Drawdown (Since Inception) |
| -- | 5.92% |
Basic Info
| Investment Strategy | |
| The Fund seeks to provide investors with a high level of monthly income by investing in a professionally managed portfolio comprised primarily of senior loans which are typically below investment grade quality. |
| General | |
| Security Type | Unlisted Closed-End Fund |
| Equity Style | -- |
| Broad Asset Class | Taxable Bond |
| Broad Category | Fixed Income |
| Global Peer Group | Loan Participation Funds |
| Peer Group | Loan Participation Funds |
| Global Macro | Loan Participation Funds |
| US Macro | General Domestic Taxable Fixed Income Funds |
| YCharts Categorization | -- |
| YCharts Benchmark | -- |
| Prospectus Objective | Loan Participation Funds |
| Fund Owner Firm Name | Voya |
| Broad Asset Class Benchmark Index | |
| ^BBUSATR | 100.0% |
Net Fund Flows Versus Peer Group
1 Month
% Rank:
--
-253.42M
Peer Group Low
759.64M
Peer Group High
1 Year
% Rank:
--
-2.001B
Peer Group Low
5.560B
Peer Group High
3 Months
% Rank:
--
-1.463B
Peer Group Low
1.631B
Peer Group High
3 Years
% Rank:
--
-2.784B
Peer Group Low
21.89B
Peer Group High
6 Months
% Rank:
--
-1.675B
Peer Group Low
3.793B
Peer Group High
5 Years
% Rank:
--
-4.082B
Peer Group Low
24.26B
Peer Group High
YTD
% Rank:
--
-1.576B
Peer Group Low
2.664B
Peer Group High
10 Years
% Rank:
--
-10.84B
Peer Group Low
24.98B
Peer Group High
Date Unavailable
Risk
Performance Versus Peer Group
Annual Total Returns Versus Peers
As of May 23, 2026.
Asset Allocation
As of March 31, 2026.
| Type | % Net |
|---|---|
| Cash | -38.13% |
| Stock | 0.00% |
| Bond | 138.1% |
| Convertible | 0.00% |
| Preferred | 0.00% |
| Other | 0.00% |
Top 10 Holdings
| Name | % Weight | Price | % Change |
|---|---|---|---|
| CCO Holdings, LLC CHTR-CCOH 4.75 03/01/2030 FIX USD Corporate 144A | 1.06% | 94.18 | -0.16% |
| OAK-EAGLE ACQUIRECO, INC. OAKEACQ 7.25 07/01/2033 FIX USD Corporate 144A | 1.04% | 103.92 | 0.30% |
| PICARD MIDCO, INC. PICAMID 6.5 03/31/2029 FIX USD Corporate 144A | 0.79% | 99.04 | 0.04% |
|
AI Aqua Merger Sub Inc FRN 30-Jul-2028
|
0.75% | -- | -- |
|
Amawaterways LLC FRN 14-Apr-2031
|
0.69% | -- | -- |
|
Chamberlain Group Inc FRN 08-Sep-2032
|
0.63% | -- | -- |
| Venture Global LNG, Inc. VENTUGL 8.125 06/01/2028 FIX USD Corporate 144A | 0.62% | 102.44 | 0.19% |
|
Cotiviti Inc [Ex-Verscend Technologies] 31-MAR-2031 Term Loan B
|
0.62% | -- | -- |
| Herc Holdings Inc. HERCHOL 7.25 06/15/2033 FIX USD Corporate 144A | 0.60% | 103.89 | 0.16% |
| Transocean International Limited TRANINBF 7.875 10/15/2032 FIX USD Corporate 144A | 0.60% | 106.86 | -0.07% |
Fees & Availability
| Fees | |
| Actual 12B-1 Fee | 0.25% |
| Actual Management Fee | 0.76% |
| Administration Fee | -- |
| Maximum Front Load | 2.50% |
| Maximum Deferred Load | -- |
| Maximum Redemption Fee | -- |
| General Availability | |
| Available for Insurance Product | No |
| Available for RRSP | No |
| Purchase Details | |
| Open to New Investors |
|
| Minimum Initial Investment | 1000.00 None |
| Minimum Subsequent Investment | 0.00 None |
Basic Info
| Investment Strategy | |
| The Fund seeks to provide investors with a high level of monthly income by investing in a professionally managed portfolio comprised primarily of senior loans which are typically below investment grade quality. |
| General | |
| Security Type | Unlisted Closed-End Fund |
| Equity Style | -- |
| Broad Asset Class | Taxable Bond |
| Broad Category | Fixed Income |
| Global Peer Group | Loan Participation Funds |
| Peer Group | Loan Participation Funds |
| Global Macro | Loan Participation Funds |
| US Macro | General Domestic Taxable Fixed Income Funds |
| YCharts Categorization | -- |
| YCharts Benchmark | -- |
| Prospectus Objective | Loan Participation Funds |
| Fund Owner Firm Name | Voya |
| Broad Asset Class Benchmark Index | |
| ^BBUSATR | 100.0% |
Fundamentals
| General | |
| Distribution Yield | -- |
| Dividend Yield TTM (5-21-26) | 8.30% |
| 30-Day SEC Yield (4-30-26) | 5.89% |
| 7-Day SEC Yield (1-31-20) | 4.89% |
| Number of Holdings | 411 |
| Bond | |
| Yield to Maturity (3-31-26) | 6.78% |
| Effective Duration | -- |
| Average Coupon | 6.69% |
| Calculated Average Quality | 5.501 |
| Effective Maturity | 5.270 |
| Nominal Maturity | 5.514 |
| Number of Bond Holdings | 391 |
As of March 31, 2026
Fund Details
Top Portfolio Holders
| Name | % Weight |
|---|---|
| Portfolio A | 5.00% |
| Portfolio B | 3.50% |
| Portfolio C | 2.25% |