

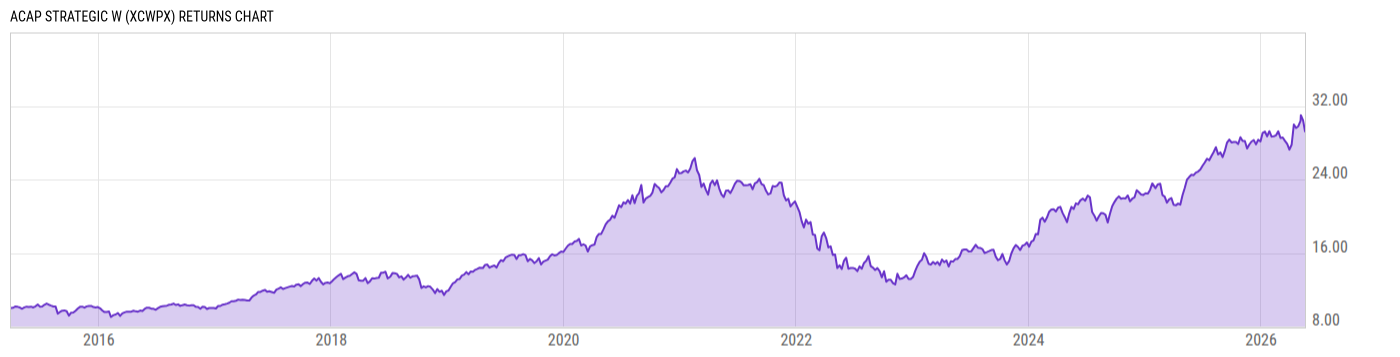
ACAP Strategic W (XCWPX)
23.23
-0.36
(-1.53%)
USD |
Jun 10 2026
Returns Chart
Key Stats
| Net Expense Ratio | Total Assets Under Management | Weighted Average Dividend Yield | Turnover Ratio (Generic) |
|---|---|---|---|
| 3.74% | -- | -0.47% | 119.0% |
| 1 Year Fund Level Flows | 1 Year Total Returns (Daily) | Annualized Total Returns Since Inception (Daily) | Max Drawdown (Since Inception) |
| -- | 18.58% |
Basic Info
| Investment Strategy | |
| The Fund seeks long-term capital appreciation. The Fund invests in equity securities of U.S. and foreign companies that the Adviser believes are well positioned to benefit from demand for their products or services, including companies that can innovate or grow rapidly relative to their peers in their markets. |
| General | |
| Security Type | Unlisted Closed-End Fund |
| Equity Style | Large Cap Growth |
| Broad Asset Class | International Equity |
| Broad Category | Equity |
| Global Peer Group | Equity Global |
| Peer Group | Global Funds |
| Global Macro | -- |
| US Macro | -- |
| YCharts Categorization | -- |
| YCharts Benchmark | -- |
| Prospectus Objective | Global Funds |
| Fund Owner Firm Name | -- |
| Broad Asset Class Benchmark Index | |
| ^MSACXUSNTR | 100.0% |
Net Fund Flows Versus Peer Group
1 Month
% Rank:
--
13.99M
Peer Group Low
13.99M
Peer Group High
1 Year
% Rank:
--
--
Peer Group Low
--
Peer Group High
3 Months
% Rank:
--
81.50M
Peer Group Low
81.50M
Peer Group High
3 Years
% Rank:
--
--
Peer Group Low
--
Peer Group High
6 Months
% Rank:
--
92.95M
Peer Group Low
92.95M
Peer Group High
5 Years
% Rank:
--
--
Peer Group Low
--
Peer Group High
YTD
% Rank:
--
83.28M
Peer Group Low
83.28M
Peer Group High
10 Years
% Rank:
--
--
Peer Group Low
--
Peer Group High
Date Unavailable
Risk
Performance Versus Peer Group
Annual Total Returns Versus Peers
As of June 11, 2026.
Asset Allocation
As of March 31, 2024.
| Type | % Net |
|---|---|
| Cash | 0.55% |
| Stock | 54.67% |
| Bond | 4.56% |
| Convertible | 0.00% |
| Preferred | 0.00% |
| Other | 40.21% |
Top 10 Holdings
| Name | % Weight | Price | % Change |
|---|---|---|---|
|
Other Assets less Liabilities
|
39.62% | -- | -- |
| Meta Platforms, Inc. | 8.72% | 566.95 | -0.71% |
| Taiwan Semiconductor Manufacturing Co., Ltd. | 7.64% | 415.91 | 1.75% |
| Amazon.com, Inc. | 7.06% | 238.50 | 0.21% |
| Safran SA | 5.05% | 337.71 | -1.33% |
| Airbus SE | 4.36% | 202.50 | -0.95% |
| BNY Dreyfus Treasury Securities Cash Mgmt Inst | 4.27% | 1.00 | 0.00% |
| Microsoft Corp. | 3.95% | 388.00 | -2.36% |
|
Morgan Stanley & Co Inc/Alphabet Inc TRS
|
3.77% | -- | -- |
| Dell Technologies, Inc. | 3.49% | 386.80 | 4.59% |
Fees & Availability
| Fees | |
| Actual 12B-1 Fee | -- |
| Actual Management Fee | 1.52% |
| Administration Fee | 619.0K% |
| Maximum Front Load | -- |
| Maximum Deferred Load | -- |
| Maximum Redemption Fee | -- |
| General Availability | |
| Available for Insurance Product | -- |
| Available for RRSP | -- |
| Purchase Details | |
| Open to New Investors |
|
| Minimum Initial Investment | 50000.00 None |
| Minimum Subsequent Investment | 5000.00 None |
Basic Info
| Investment Strategy | |
| The Fund seeks long-term capital appreciation. The Fund invests in equity securities of U.S. and foreign companies that the Adviser believes are well positioned to benefit from demand for their products or services, including companies that can innovate or grow rapidly relative to their peers in their markets. |
| General | |
| Security Type | Unlisted Closed-End Fund |
| Equity Style | Large Cap Growth |
| Broad Asset Class | International Equity |
| Broad Category | Equity |
| Global Peer Group | Equity Global |
| Peer Group | Global Funds |
| Global Macro | -- |
| US Macro | -- |
| YCharts Categorization | -- |
| YCharts Benchmark | -- |
| Prospectus Objective | Global Funds |
| Fund Owner Firm Name | -- |
| Broad Asset Class Benchmark Index | |
| ^MSACXUSNTR | 100.0% |
Fundamentals
| General | |
| Distribution Yield | -- |
| Dividend Yield TTM (6-10-26) | 0.00% |
| 30-Day SEC Yield | -- |
| 7-Day SEC Yield | -- |
| Number of Holdings | 213 |
Fund Details
| Key Dates | |
| Inception Date | -- |
| Last Annual Report Date | 9/30/2023 |
| Last Prospectus Date | 1/14/2022 |
| Share Classes | |
| XCAPX | A |
| Attributes | |
| Index Fund | -- |
| Inverse Fund | -- |
| Leveraged Fund |
|
| Fund of Funds | No |
| Currency Hedged Fund | -- |
| Socially Responsible Fund | No |
Top Portfolio Holders
| Name | % Weight |
|---|---|
| Portfolio A | 5.00% |
| Portfolio B | 3.50% |
| Portfolio C | 2.25% |