

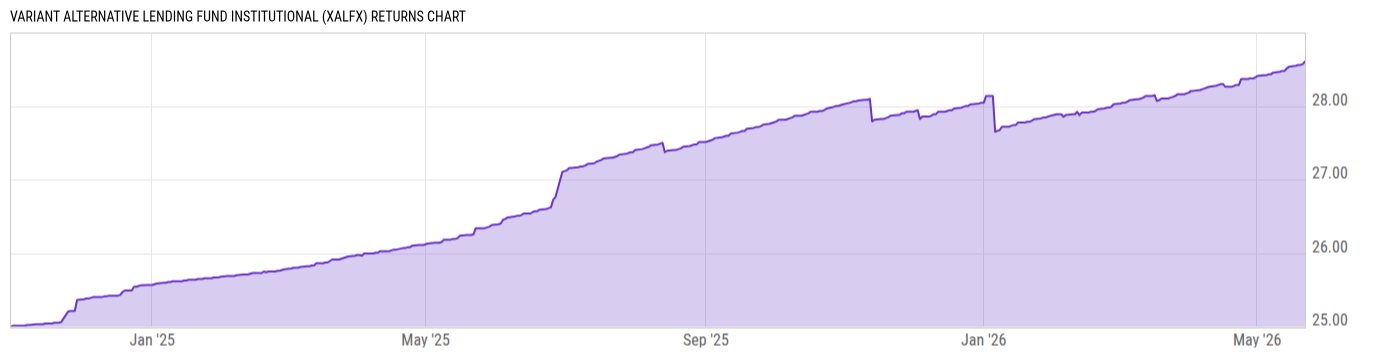
Variant Alternative Lending Fund Institutional (XALFX)
24.55
+0.03
(+0.12%)
USD |
May 22 2026
Returns Chart
Key Stats
| Net Expense Ratio | Total Assets Under Management | Weighted Average Dividend Yield | Turnover Ratio (Generic) |
|---|---|---|---|
| 1.30% | 72.52M | -- | 0.01% |
| 1 Year Fund Level Flows | 1 Year Total Returns (Daily) | Annualized Total Returns Since Inception (Daily) | Max Drawdown (Since Inception) |
| -- | 8.95% |
Basic Info
| Investment Strategy | |
| The Fund seeks to provide a high level of current income while seeking to prioritize capital preservation. Capital appreciation is considered a secondary objective. The Fund seeks to achieve its investment objective by investing directly or indirectly in senior secured alternative income-generating lending investments. |
| General | |
| Security Type | Unlisted Closed-End Fund |
| Equity Style | -- |
| Broad Asset Class | Allocation |
| Broad Category | Allocation |
| Global Peer Group | Mixed Asset USD Conservative |
| Peer Group | Income & Preferred Stock Funds |
| Global Macro | Mixed Asset HC Conservative |
| US Macro | Mixed-Assets Target Allocation Funds |
| YCharts Categorization | -- |
| YCharts Benchmark | -- |
| Prospectus Objective | Income & Preferred Stock Funds |
| Fund Owner Firm Name | Variant |
| Broad Asset Class Benchmark Index | |
| ^SPXTR | 100.0% |
Net Fund Flows Versus Peer Group
1 Month
% Rank:
--
--
Peer Group Low
--
Peer Group High
1 Year
% Rank:
--
--
Peer Group Low
--
Peer Group High
3 Months
% Rank:
--
--
Peer Group Low
--
Peer Group High
3 Years
% Rank:
--
--
Peer Group Low
--
Peer Group High
6 Months
% Rank:
--
--
Peer Group Low
--
Peer Group High
5 Years
% Rank:
--
--
Peer Group Low
--
Peer Group High
YTD
% Rank:
--
--
Peer Group Low
--
Peer Group High
10 Years
% Rank:
--
--
Peer Group Low
--
Peer Group High
Date Unavailable
Risk
Performance Versus Peer Group
Annual Total Returns Versus Peers
As of May 25, 2026.
Asset Allocation
As of March 31, 2026.
| Type | % Net |
|---|---|
| Cash | 6.25% |
| Stock | 24.89% |
| Bond | 53.80% |
| Convertible | 0.00% |
| Preferred | 0.00% |
| Other | 15.06% |
Top 10 Holdings
| Name | % Weight | Price | % Change |
|---|---|---|---|
| Goldman Sachs FS Government Fund Institutional | 10.72% | 1.00 | 0.00% |
|
Station Road Capital Management II LLC FRN
|
9.35% | -- | -- |
|
Okoa Capital LLC
|
9.17% | -- | -- |
|
Rivonia Road Fund Lp
|
8.54% | -- | -- |
|
BEB SPV I LLC FRN
|
8.18% | -- | -- |
|
Preferred Point LLC FRN
|
6.01% | -- | -- |
|
Unifund CCR LLC
|
5.58% | -- | -- |
|
Highmore (Jardine) Participation FRN
|
5.19% | -- | -- |
|
Marquis United LLC FRN
|
4.12% | -- | -- |
|
Copperpot Finance LLC FRN
|
4.00% | -- | -- |
Fees & Availability
| Fees | |
| Actual 12B-1 Fee | -- |
| Actual Management Fee | 1.25% |
| Administration Fee | 43.98K% |
| Maximum Front Load | -- |
| Maximum Deferred Load | -- |
| Maximum Redemption Fee | -- |
| General Availability | |
| Available for Insurance Product | No |
| Available for RRSP | No |
| Purchase Details | |
| Open to New Investors |
|
| Minimum Initial Investment | 1.00M None |
| Minimum Subsequent Investment | 0.00 None |
Basic Info
| Investment Strategy | |
| The Fund seeks to provide a high level of current income while seeking to prioritize capital preservation. Capital appreciation is considered a secondary objective. The Fund seeks to achieve its investment objective by investing directly or indirectly in senior secured alternative income-generating lending investments. |
| General | |
| Security Type | Unlisted Closed-End Fund |
| Equity Style | -- |
| Broad Asset Class | Allocation |
| Broad Category | Allocation |
| Global Peer Group | Mixed Asset USD Conservative |
| Peer Group | Income & Preferred Stock Funds |
| Global Macro | Mixed Asset HC Conservative |
| US Macro | Mixed-Assets Target Allocation Funds |
| YCharts Categorization | -- |
| YCharts Benchmark | -- |
| Prospectus Objective | Income & Preferred Stock Funds |
| Fund Owner Firm Name | Variant |
| Broad Asset Class Benchmark Index | |
| ^SPXTR | 100.0% |
Fundamentals
| General | |
| Distribution Yield | -- |
| Dividend Yield TTM (5-21-26) | 11.14% |
| 30-Day SEC Yield | -- |
| 7-Day SEC Yield | -- |
| Number of Holdings | 33 |
| Stock | |
| Weighted Average PE Ratio | -- |
| Weighted Average Price to Sales Ratio | -- |
| Weighted Average Price to Book Ratio | -- |
| Weighted Median ROE | -- |
| Weighted Median ROA | -- |
| ROI (TTM) | -- |
| Return on Investment (TTM) | -- |
| Earning Yield | -- |
| LT Debt / Shareholders Equity | -- |
| Number of Equity Holdings | 10 |
| Bond | |
| Yield to Maturity (3-31-26) | -- |
| Effective Duration | -- |
| Average Coupon | -- |
| Calculated Average Quality | -- |
| Effective Maturity | -0.3441 |
| Nominal Maturity | -0.3441 |
| Number of Bond Holdings | 14 |
As of March 31, 2026
Growth Metrics
| EPS Growth (1Y) | -- |
| EPS Growth (3Y) | -- |
| EPS Growth (5Y) | -- |
| Sales Growth (1Y) | -- |
| Sales Growth (3Y) | -- |
| Sales Growth (5Y) | -- |
| Sales per Share Growth (1Y) | -- |
| Sales per Share Growth (3Y) | -- |
| Operating Cash Flow - Growth Rate (3Y) | -- |
As of March 31, 2026
Fund Details
| Key Dates | |
| Launch Date | 10/31/2024 |
| Last Annual Report Date | 4/30/2025 |
| Last Prospectus Date | 11/3/2025 |
| Attributes | |
| Index Fund | -- |
| Inverse Fund | No |
| Leveraged Fund | -- |
| Fund of Funds | No |
| Currency Hedged Fund | -- |
| Socially Responsible Fund | No |
Top Portfolio Holders
| Name | % Weight |
|---|---|
| Portfolio A | 5.00% |
| Portfolio B | 3.50% |
| Portfolio C | 2.25% |