

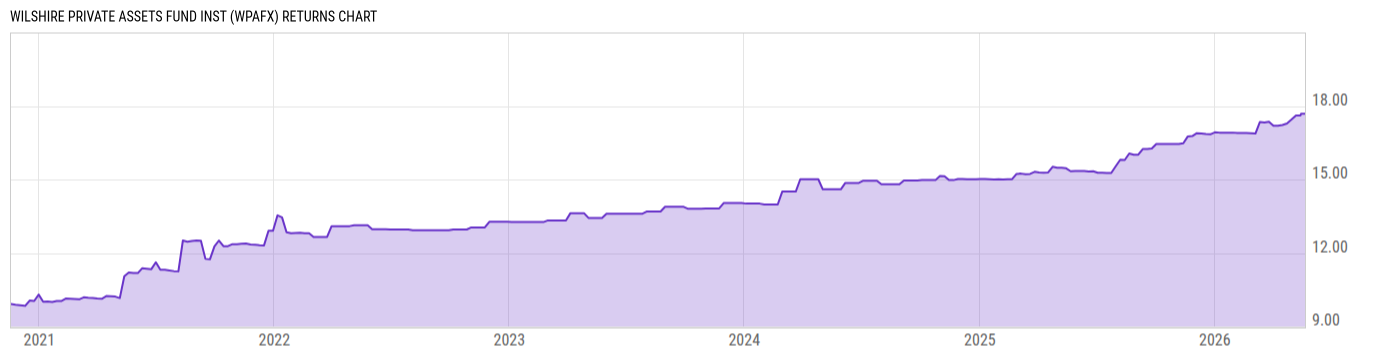
Wilshire Private Assets Fund Inst (WPAFX)
14.77
0.00 (0.00%)
USD |
Jun 10 2026
Returns Chart
Key Stats
| Net Expense Ratio | Total Assets Under Management | Weighted Average Dividend Yield | Turnover Ratio (Generic) |
|---|---|---|---|
| 5.11% | 146.91M | -- | 4.00% |
| 1 Year Fund Level Flows | 1 Year Total Returns (Daily) | Annualized Total Returns Since Inception (Daily) | Max Drawdown (Since Inception) |
| -- | 16.34% |
Basic Info
| Investment Strategy | |
| The Fund seeks to provide efficient access to the private markets with the goals of offering long-term capital appreciation and current income. The Fund invests substantially all of its assets in Wilshire Private Assets Master Fund and Funds portfolio typically will consist solely of the Master Funds shares. |
| General | |
| Security Type | Unlisted Closed-End Fund |
| Equity Style | -- |
| Broad Asset Class | Sector Equity |
| Broad Category | Equity |
| Global Peer Group | Equity Other |
| Peer Group | Sector Equity Funds |
| Global Macro | Equity Other |
| US Macro | -- |
| YCharts Categorization | -- |
| YCharts Benchmark | -- |
| Prospectus Objective | Sector Equity Funds |
| Fund Owner Firm Name | Wilshire |
| Broad Asset Class Benchmark Index | |
| ^MSWNTR | 100.0% |
Net Fund Flows Versus Peer Group
1 Month
% Rank:
--
157.11M
Peer Group Low
157.11M
Peer Group High
1 Year
% Rank:
--
2.180B
Peer Group Low
2.180B
Peer Group High
3 Months
% Rank:
--
495.40M
Peer Group Low
495.40M
Peer Group High
3 Years
% Rank:
--
3.823B
Peer Group Low
3.823B
Peer Group High
6 Months
% Rank:
--
1.045B
Peer Group Low
1.045B
Peer Group High
5 Years
% Rank:
--
--
Peer Group Low
--
Peer Group High
YTD
% Rank:
--
616.64M
Peer Group Low
616.64M
Peer Group High
10 Years
% Rank:
--
--
Peer Group Low
--
Peer Group High
Date Unavailable
Risk
Performance Versus Peer Group
Annual Total Returns Versus Peers
As of June 11, 2026.
Asset Allocation
As of December 31, 2025.
| Type | % Net |
|---|---|
| Cash | -0.63% |
| Stock | 35.88% |
| Bond | 23.42% |
| Convertible | 0.00% |
| Preferred | 0.00% |
| Other | 41.33% |
Top 10 Holdings
| Name | % Weight | Price | % Change |
|---|---|---|---|
| BlackRock Liquidity Treasury Trust Fund Inst | 22.79% | 1.00 | 0.00% |
|
Linden Structured Capital Fund LP
|
9.37% | -- | -- |
|
Overbay Capital Partners Inc
|
8.76% | -- | -- |
|
Buhuovc LP
|
8.37% | -- | -- |
|
Star Mountain Strategic Credit Income Fund IV Offshore LP
|
6.89% | -- | -- |
|
MidOcean Absolute Return Credit Fund LP
|
4.64% | -- | -- |
|
Basalt Infrastructure Partners II LP
|
4.33% | -- | -- |
|
Amber Hill Investments SPC Ltd
|
3.92% | -- | -- |
|
Ascend Smg Co-Invest 3 LP
|
3.63% | -- | -- |
|
Grant Avenue Capital Brave Co Invest Fund A LP
|
3.54% | -- | -- |
Fees & Availability
| Fees | |
| Actual 12B-1 Fee | -- |
| Actual Management Fee | 0.38% |
| Administration Fee | 130.0K% |
| Maximum Front Load | -- |
| Maximum Deferred Load | -- |
| Maximum Redemption Fee | -- |
| General Availability | |
| Available for Insurance Product | No |
| Available for RRSP | No |
| Purchase Details | |
| Open to New Investors |
|
| Minimum Initial Investment | 25000.00 None |
| Minimum Subsequent Investment | 5000.00 None |
Basic Info
| Investment Strategy | |
| The Fund seeks to provide efficient access to the private markets with the goals of offering long-term capital appreciation and current income. The Fund invests substantially all of its assets in Wilshire Private Assets Master Fund and Funds portfolio typically will consist solely of the Master Funds shares. |
| General | |
| Security Type | Unlisted Closed-End Fund |
| Equity Style | -- |
| Broad Asset Class | Sector Equity |
| Broad Category | Equity |
| Global Peer Group | Equity Other |
| Peer Group | Sector Equity Funds |
| Global Macro | Equity Other |
| US Macro | -- |
| YCharts Categorization | -- |
| YCharts Benchmark | -- |
| Prospectus Objective | Sector Equity Funds |
| Fund Owner Firm Name | Wilshire |
| Broad Asset Class Benchmark Index | |
| ^MSWNTR | 100.0% |
Fundamentals
| General | |
| Distribution Yield | -- |
| Dividend Yield TTM (6-10-26) | 0.25% |
| 30-Day SEC Yield | -- |
| 7-Day SEC Yield | -- |
| Number of Holdings | 27 |
| Stock | |
| Weighted Average PE Ratio | -- |
| Weighted Average Price to Sales Ratio | -- |
| Weighted Average Price to Book Ratio | -- |
| Weighted Median ROE | -- |
| Weighted Median ROA | -- |
| ROI (TTM) | -- |
| Return on Investment (TTM) | -- |
| Earning Yield | -- |
| LT Debt / Shareholders Equity | -- |
| Number of Equity Holdings | 13 |
| Bond | |
| Yield to Maturity (12-31-25) | -- |
| Effective Duration | -- |
| Average Coupon | -- |
| Calculated Average Quality | -- |
| Effective Maturity | -- |
| Nominal Maturity | -- |
| Number of Bond Holdings | 0 |
As of December 31, 2025
Growth Metrics
| EPS Growth (1Y) | -- |
| EPS Growth (3Y) | -- |
| EPS Growth (5Y) | -- |
| Sales Growth (1Y) | -- |
| Sales Growth (3Y) | -- |
| Sales Growth (5Y) | -- |
| Sales per Share Growth (1Y) | -- |
| Sales per Share Growth (3Y) | -- |
| Operating Cash Flow - Growth Rate (3Y) | -- |
As of December 31, 2025
Fund Details
| Key Dates | |
| Launch Date | 11/18/2020 |
| Last Annual Report Date | 3/31/2025 |
| Last Prospectus Date | 10/19/2025 |
| Attributes | |
| Index Fund | -- |
| Inverse Fund | No |
| Leveraged Fund | -- |
| Fund of Funds | No |
| Currency Hedged Fund | -- |
| Socially Responsible Fund | No |
Top Portfolio Holders
| Name | % Weight |
|---|---|
| Portfolio A | 5.00% |
| Portfolio B | 3.50% |
| Portfolio C | 2.25% |