

Wilmington US Government Money Market Fund Select (WGEXX)
1.00
0.00 (0.00%)
USD |
Jun 09 2026
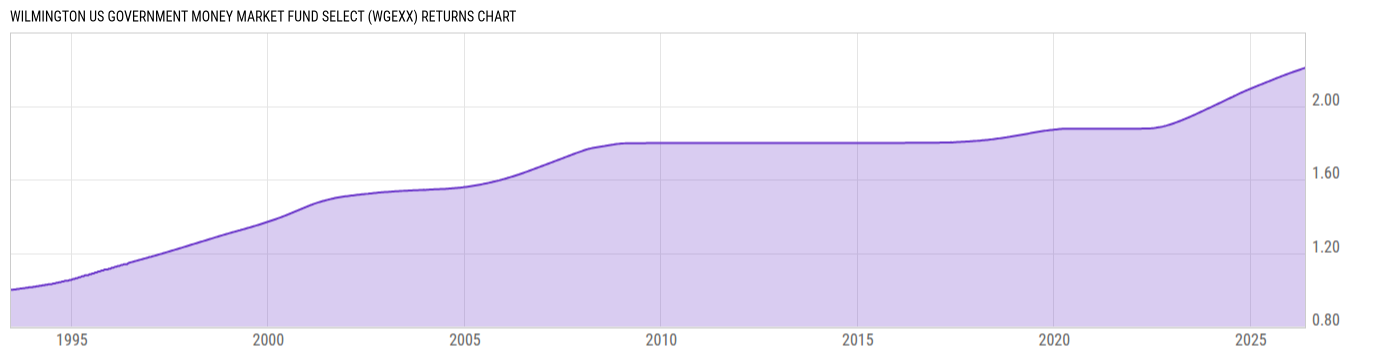
Returns Chart
Key Stats
| Net Expense Ratio | Total Assets Under Management | Weighted Average Dividend Yield | Turnover Ratio (Generic) |
|---|---|---|---|
| 0.32% | 10.39B | -- | -- |
| 1 Year Fund Level Flows | 1 Year Total Returns (Daily) | Annualized Total Returns Since Inception (Daily) | Max Drawdown (Since Inception) |
| 1.386B | 3.64% |
Basic Info
| Investment Strategy | |
| The Fund seeks to provide current income while maintaining liquidity and stability of principal. It invests at least 80% of its net assets in US government securities and repurchase agreements that are fully collateralized by US govt securities. The 80% policy does not include repurchase agreements collateralized by cash. |
| General | |
| Security Type | Money Market Fund |
| Equity Style | -- |
| Broad Asset Class | Money Market |
| Broad Category | Capital Preservation |
| Global Peer Group | Money Market USD |
| Peer Group | Instl U.S. Government Money Market Funds |
| Global Macro | Money Market HC |
| US Macro | Taxable Money Market Funds |
| YCharts Categorization | -- |
| YCharts Benchmark | -- |
| Prospectus Objective | Instl U.S. Government Money Market Funds |
| Fund Owner Firm Name | Wilmington Funds |
| Broad Asset Class Benchmark Index | |
| ^BBUTB13MTR | 100.0% |
Net Fund Flows Versus Peer Group
1 Month
% Rank:
59
-7.017B
Peer Group Low
25.65B
Peer Group High
1 Year
% Rank:
45
1.386B
-5.811B
Peer Group Low
46.82B
Peer Group High
3 Months
% Rank:
25
-21.49B
Peer Group Low
13.98B
Peer Group High
3 Years
% Rank:
54
-19.08B
Peer Group Low
149.96B
Peer Group High
6 Months
% Rank:
30
-13.14B
Peer Group Low
26.50B
Peer Group High
5 Years
% Rank:
55
-37.54B
Peer Group Low
190.74B
Peer Group High
YTD
% Rank:
43
-17.29B
Peer Group Low
20.47B
Peer Group High
10 Years
% Rank:
69
-14.28B
Peer Group Low
341.23B
Peer Group High
Date Unavailable
Risk
Performance Versus Peer Group
Annual Total Returns Versus Peers
As of June 10, 2026.
Asset Allocation
As of April 30, 2026.
| Type | % Net |
|---|---|
| Cash | 40.97% |
| Stock | 0.00% |
| Bond | 59.22% |
| Convertible | 0.00% |
| Preferred | 0.00% |
| Other | -0.19% |
Top 10 Holdings
| Name | % Weight | Price | % Change |
|---|---|---|---|
|
Fixed Income Clearing Corp Repo
|
19.62% | -- | -- |
|
SMBC Bank International PLC Repo
|
9.17% | -- | -- |
|
CIBC World Markets Corp Repo
|
8.25% | -- | -- |
|
Deutsche Bank Securities Inc Repo
|
1.93% | -- | -- |
| Federal Home Loan Banks FHLB 08/04/2027 FLT USD Agency | 1.60% | 100.11 | 0.00% |
| Federal Home Loan Banks FHLB 10/20/2026 FLT USD Agency | 1.38% | 100.01 | 0.00% |
|
TD Securities Inc Repo
|
1.38% | -- | -- |
| Federal Home Loan Banks FHLB 12/07/2026 FLT USD Agency | 1.38% | 100.01 | 0.00% |
| Federal Farm Credit Banks Funding Corporation FFCB 03/15/2027 FLT USD Agency | 1.38% | 100.04 | 0.00% |
| United States of America USGB 05/05/2026 FIX USD Government (Matured) | 1.38% | 100.00 | 0.01% |
Fees & Availability
| Fees | |
| Actual 12B-1 Fee | -- |
| Actual Management Fee | 0.01% |
| Administration Fee | 1.60M% |
| Maximum Front Load | -- |
| Maximum Deferred Load | -- |
| Maximum Redemption Fee | -- |
| General Availability | |
| Available for Insurance Product | No |
| Available for RRSP | No |
| Purchase Details | |
| Open to New Investors |
|
| Minimum Initial Investment | 100000.0 None |
| Minimum Subsequent Investment | 25.00 None |
Basic Info
| Investment Strategy | |
| The Fund seeks to provide current income while maintaining liquidity and stability of principal. It invests at least 80% of its net assets in US government securities and repurchase agreements that are fully collateralized by US govt securities. The 80% policy does not include repurchase agreements collateralized by cash. |
| General | |
| Security Type | Money Market Fund |
| Equity Style | -- |
| Broad Asset Class | Money Market |
| Broad Category | Capital Preservation |
| Global Peer Group | Money Market USD |
| Peer Group | Instl U.S. Government Money Market Funds |
| Global Macro | Money Market HC |
| US Macro | Taxable Money Market Funds |
| YCharts Categorization | -- |
| YCharts Benchmark | -- |
| Prospectus Objective | Instl U.S. Government Money Market Funds |
| Fund Owner Firm Name | Wilmington Funds |
| Broad Asset Class Benchmark Index | |
| ^BBUTB13MTR | 100.0% |
Fundamentals
| General | |
| Distribution Yield | -- |
| Dividend Yield TTM (6-9-26) | 3.68% |
| 30-Day SEC Yield (4-29-22) | 0.00% |
| 7-Day SEC Yield (5-31-26) | 3.40% |
| Number of Holdings | 58 |
| Bond | |
| Yield to Maturity (4-30-26) | -- |
| Effective Duration | -- |
| Average Coupon | -- |
| Calculated Average Quality | -- |
| Effective Maturity | -- |
| Nominal Maturity | -- |
| Number of Bond Holdings | 49 |
As of April 30, 2026
Fund Details
Top Portfolio Holders
| Name | % Weight |
|---|---|
| Portfolio A | 5.00% |
| Portfolio B | 3.50% |
| Portfolio C | 2.25% |