

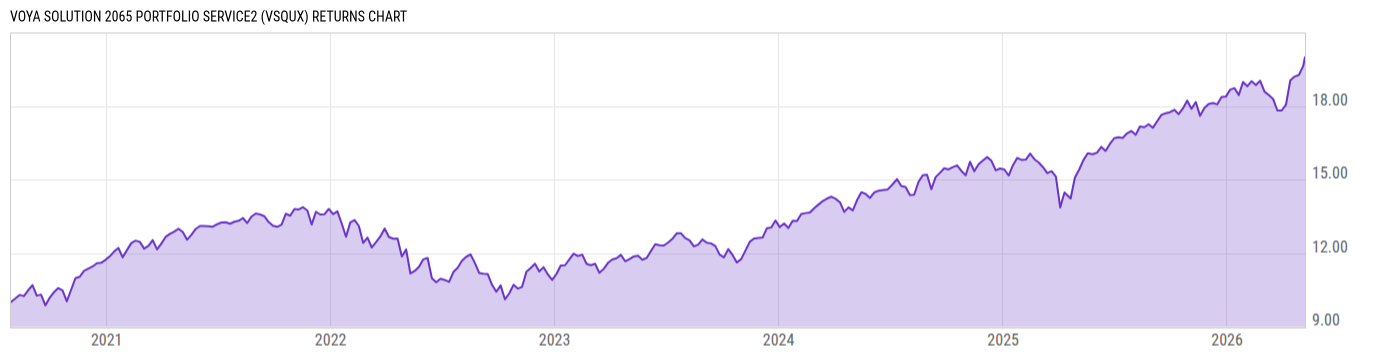
Voya Solution 2065 Portfolio Service2 (VSQUX)
12.97
+0.02
(+0.15%)
USD |
May 29 2026
Returns Chart
Key Stats
| Net Expense Ratio | Total Assets Under Management | Weighted Average Dividend Yield | Turnover Ratio (Generic) |
|---|---|---|---|
| 1.18% | 30.67M | -- | 51.00% |
| 1 Year Fund Level Flows | 1 Year Total Returns (Daily) | Annualized Total Returns Since Inception (Daily) | Max Drawdown (Since Inception) |
| 1.427M | 27.66% |
Basic Info
| Investment Strategy | |
| The Fund seeks to provide total return consistent with an asset allocation targeted at retirement in approximately 2065. The Fund invests in stocks, international stocks, US bonds and other fixed income investments, and uses an asset allocation strategy designed for investors expecting to retire around the year 2065. |
| General | |
| Security Type | Insurance Fund |
| Equity Style | -- |
| Broad Asset Class | Allocation |
| Broad Category | Allocation |
| Global Peer Group | Target Maturity MA USD 2060+ |
| Peer Group | Mixed-Asset Target 2060+ Funds |
| Global Macro | Target Maturity |
| US Macro | Mixed-Assets Target Date Funds |
| YCharts Categorization | -- |
| YCharts Benchmark | -- |
| Prospectus Objective | Growth Funds |
| Fund Owner Firm Name | Voya |
| Broad Asset Class Benchmark Index | |
| ^SPXTR | 100.0% |
Net Fund Flows Versus Peer Group
1 Month
% Rank:
99
-14.34M
Peer Group Low
322.36M
Peer Group High
1 Year
% Rank:
84
1.427M
-5.991M
Peer Group Low
2.735B
Peer Group High
3 Months
% Rank:
71
-16.64M
Peer Group Low
946.30M
Peer Group High
3 Years
% Rank:
65
185845.0
Peer Group Low
6.529B
Peer Group High
6 Months
% Rank:
59
-14.16M
Peer Group Low
1.544B
Peer Group High
5 Years
% Rank:
61
185845.0
Peer Group Low
8.198B
Peer Group High
YTD
% Rank:
57
-25.12M
Peer Group Low
946.30M
Peer Group High
10 Years
% Rank:
61
185845.0
Peer Group Low
9.176B
Peer Group High
Date Unavailable
Risk
Performance Versus Peer Group
Annual Total Returns Versus Peers
As of May 30, 2026.
Asset Allocation
As of March 31, 2026.
| Type | % Net |
|---|---|
| Cash | 4.03% |
| Stock | 91.24% |
| Bond | 2.96% |
| Convertible | 0.00% |
| Preferred | 0.27% |
| Other | 1.51% |
Top 10 Holdings
| Name | % Weight | Price | % Change |
|---|---|---|---|
| Voya US Stock Index Portfolio Institutional | 37.79% | 23.41 | 0.21% |
| Voya Multi-Manager International Equity Fund I | 20.61% | 12.89 | 0.23% |
| Voya Russell Large Cap Growth Index Portfolio I | 7.56% | 78.28 | 0.53% |
| Vanguard Developed Markets Index Fund ETF | 7.04% | 71.77 | 0.15% |
| Voya Multi-Manager Emerging Markets Equity Fund I | 4.99% | 17.14 | -0.12% |
| Voya Large Cap Value Fund R6 | 4.98% | 14.78 | 0.14% |
| VY T Rowe Price Capital Appreciation Port R6 | 3.77% | 28.32 | 0.32% |
| Vanguard Emerging Markets Stock Index Fund ETF | 3.01% | 59.88 | -0.03% |
| Voya Multi-Manager Mid Cap Value Fund I | 2.48% | 9.87 | 0.00% |
|
5YR T NOTE JUN26
|
2.43% | -- | -- |
Fees & Availability
| Fees | |
| Actual 12B-1 Fee | 0.40% |
| Actual Management Fee | -- |
| Administration Fee | -- |
| Maximum Front Load | -- |
| Maximum Deferred Load | -- |
| Maximum Redemption Fee | -- |
| General Availability | |
| Available for Insurance Product |
|
| Available for RRSP | No |
| Purchase Details | |
| Open to New Investors |
|
| Minimum Initial Investment | 0.00 None |
| Minimum Subsequent Investment | 0.00 None |
Basic Info
| Investment Strategy | |
| The Fund seeks to provide total return consistent with an asset allocation targeted at retirement in approximately 2065. The Fund invests in stocks, international stocks, US bonds and other fixed income investments, and uses an asset allocation strategy designed for investors expecting to retire around the year 2065. |
| General | |
| Security Type | Insurance Fund |
| Equity Style | -- |
| Broad Asset Class | Allocation |
| Broad Category | Allocation |
| Global Peer Group | Target Maturity MA USD 2060+ |
| Peer Group | Mixed-Asset Target 2060+ Funds |
| Global Macro | Target Maturity |
| US Macro | Mixed-Assets Target Date Funds |
| YCharts Categorization | -- |
| YCharts Benchmark | -- |
| Prospectus Objective | Growth Funds |
| Fund Owner Firm Name | Voya |
| Broad Asset Class Benchmark Index | |
| ^SPXTR | 100.0% |
Fundamentals
| General | |
| Distribution Yield | -- |
| Dividend Yield TTM (5-28-26) | 2.48% |
| 30-Day SEC Yield | -- |
| 7-Day SEC Yield | -- |
| Number of Holdings | 19 |
| Stock | |
| Weighted Average PE Ratio | 28.17 |
| Weighted Average Price to Sales Ratio | 6.668 |
| Weighted Average Price to Book Ratio | 8.237 |
| Weighted Median ROE | 73.17% |
| Weighted Median ROA | 13.78% |
| ROI (TTM) | 24.70% |
| Return on Investment (TTM) | 24.70% |
| Earning Yield | 0.0464 |
| LT Debt / Shareholders Equity | 0.6926 |
| Number of Equity Holdings | 0 |
As of March 31, 2026
Growth Metrics
| EPS Growth (1Y) | 24.37% |
| EPS Growth (3Y) | 17.12% |
| EPS Growth (5Y) | 22.03% |
| Sales Growth (1Y) | 13.55% |
| Sales Growth (3Y) | 12.59% |
| Sales Growth (5Y) | 14.49% |
| Sales per Share Growth (1Y) | 31.72% |
| Sales per Share Growth (3Y) | 13.08% |
| Operating Cash Flow - Growth Rate (3Y) | 21.86% |
As of March 31, 2026
Fund Details
Top Portfolio Holders
| Name | % Weight |
|---|---|
| Portfolio A | 5.00% |
| Portfolio B | 3.50% |
| Portfolio C | 2.25% |