

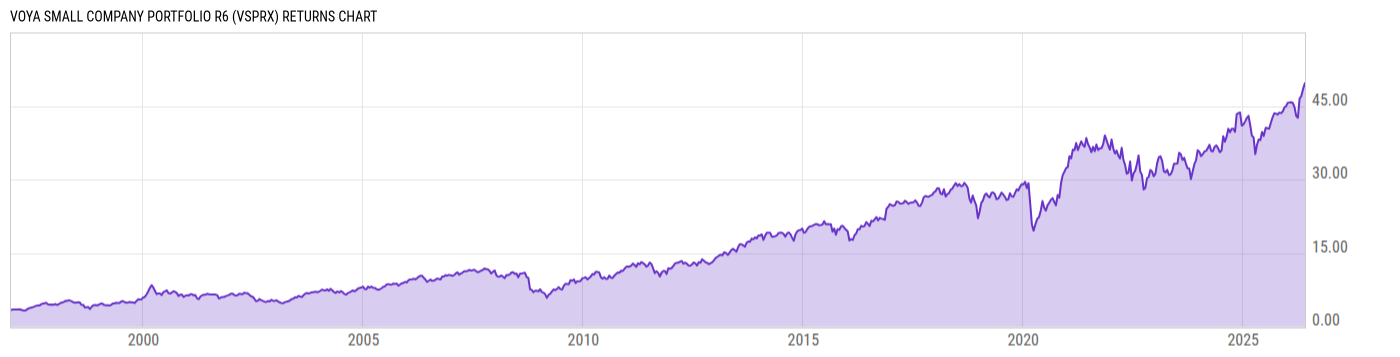
Voya Small Company Portfolio R6 (VSPRX)
15.39
-0.05
(-0.32%)
USD |
May 29 2026
Returns Chart
Key Stats
| Net Expense Ratio | Total Assets Under Management | Weighted Average Dividend Yield | Turnover Ratio (Generic) |
|---|---|---|---|
| 0.80% | 207.60M | 1.17% | 111.0% |
| 1 Year Fund Level Flows | 1 Year Total Returns (Daily) | Annualized Total Returns Since Inception (Daily) | Max Drawdown (Since Inception) |
| -74.86M | 27.69% |
Basic Info
| Investment Strategy | |
| The Fund seeks growth of capital primarily through investment in a diversified portfolio of common stocks of companies with smaller market capitalizations. The Fund defines small-capitalization companies as companies that are included in the S&P SmallCap 600 Index or the Russell 2000 Index. |
| General | |
| Security Type | Insurance Fund |
| Equity Style | Small Cap Core |
| Broad Asset Class | US Equity |
| Broad Category | Equity |
| Global Peer Group | Equity US Sm&Mid Cap |
| Peer Group | Small-Cap Core Funds |
| Global Macro | Equity North America |
| US Macro | Small-Cap Funds |
| YCharts Categorization | -- |
| YCharts Benchmark | -- |
| Prospectus Objective | Small-Cap Funds |
| Fund Owner Firm Name | Voya |
| Broad Asset Class Benchmark Index | |
| ^SPXTR | 100.0% |
Net Fund Flows Versus Peer Group
1 Month
% Rank:
50
-1.414B
Peer Group Low
769.95M
Peer Group High
1 Year
% Rank:
66
-74.86M
-7.059B
Peer Group Low
2.189B
Peer Group High
3 Months
% Rank:
47
-1.388B
Peer Group Low
995.56M
Peer Group High
3 Years
% Rank:
65
-5.254B
Peer Group Low
6.142B
Peer Group High
6 Months
% Rank:
47
-3.555B
Peer Group Low
1.954B
Peer Group High
5 Years
% Rank:
68
-8.053B
Peer Group Low
7.929B
Peer Group High
YTD
% Rank:
50
-5.360B
Peer Group Low
1.730B
Peer Group High
10 Years
% Rank:
70
-10.79B
Peer Group Low
29.63B
Peer Group High
Date Unavailable
Risk
Performance Versus Peer Group
Annual Total Returns Versus Peers
As of May 31, 2026.
Asset Allocation
As of April 30, 2026.
| Type | % Net |
|---|---|
| Cash | 0.05% |
| Stock | 99.87% |
| Bond | 0.08% |
| Convertible | 0.00% |
| Preferred | 0.00% |
| Other | 0.00% |
Top 10 Holdings
| Name | % Weight | Price | % Change |
|---|---|---|---|
| Bloom Energy Corp. | 2.71% | 285.00 | -1.73% |
| CareTrust REIT, Inc. | 2.13% | 40.82 | -1.02% |
| Mueller Water Products, Inc. | 2.00% | 25.21 | -0.59% |
| TTM Technologies, Inc. | 1.93% | 173.72 | -7.49% |
| Flowserve Corp. | 1.50% | 75.51 | 0.40% |
| Super Group (SGHC) Ltd. | 1.22% | 12.45 | -2.43% |
| Applied Industrial Technologies, Inc. | 1.22% | 303.81 | -1.53% |
| Kohl's Corp. | 1.19% | 14.36 | -7.89% |
| Black Hills Corp. | 1.12% | 72.82 | -0.37% |
| Hecla Mining Co. | 1.06% | 17.77 | 1.02% |
Fees & Availability
| Fees | |
| Actual 12B-1 Fee | -- |
| Actual Management Fee | 0.75% |
| Administration Fee | -- |
| Maximum Front Load | -- |
| Maximum Deferred Load | -- |
| Maximum Redemption Fee | -- |
| General Availability | |
| Available for Insurance Product |
|
| Available for RRSP | No |
| Purchase Details | |
| Open to New Investors |
|
| Minimum Initial Investment | 0.00 None |
| Minimum Subsequent Investment | 0.00 None |
Basic Info
| Investment Strategy | |
| The Fund seeks growth of capital primarily through investment in a diversified portfolio of common stocks of companies with smaller market capitalizations. The Fund defines small-capitalization companies as companies that are included in the S&P SmallCap 600 Index or the Russell 2000 Index. |
| General | |
| Security Type | Insurance Fund |
| Equity Style | Small Cap Core |
| Broad Asset Class | US Equity |
| Broad Category | Equity |
| Global Peer Group | Equity US Sm&Mid Cap |
| Peer Group | Small-Cap Core Funds |
| Global Macro | Equity North America |
| US Macro | Small-Cap Funds |
| YCharts Categorization | -- |
| YCharts Benchmark | -- |
| Prospectus Objective | Small-Cap Funds |
| Fund Owner Firm Name | Voya |
| Broad Asset Class Benchmark Index | |
| ^SPXTR | 100.0% |
Fundamentals
| General | |
| Distribution Yield | -- |
| Dividend Yield TTM (5-28-26) | 0.78% |
| 30-Day SEC Yield | -- |
| 7-Day SEC Yield | -- |
| Number of Holdings | 10 |
| Stock | |
| Weighted Average PE Ratio | 27.95 |
| Weighted Average Price to Sales Ratio | 6.519 |
| Weighted Average Price to Book Ratio | 5.830 |
| Weighted Median ROE | -3.81% |
| Weighted Median ROA | 1.64% |
| ROI (TTM) | 4.03% |
| Return on Investment (TTM) | 4.03% |
| Earning Yield | 0.0537 |
| LT Debt / Shareholders Equity | 1.474 |
| Number of Equity Holdings | 10 |
As of April 30, 2026
Growth Metrics
| EPS Growth (1Y) | 26.51% |
| EPS Growth (3Y) | 9.01% |
| EPS Growth (5Y) | 13.36% |
| Sales Growth (1Y) | 18.94% |
| Sales Growth (3Y) | 12.51% |
| Sales Growth (5Y) | 14.49% |
| Sales per Share Growth (1Y) | 764.6% |
| Sales per Share Growth (3Y) | 8.42% |
| Operating Cash Flow - Growth Rate (3Y) | 22.70% |
As of April 30, 2026
Fund Details
Top Portfolio Holders
| Name | % Weight |
|---|---|
| Portfolio A | 5.00% |
| Portfolio B | 3.50% |
| Portfolio C | 2.25% |