

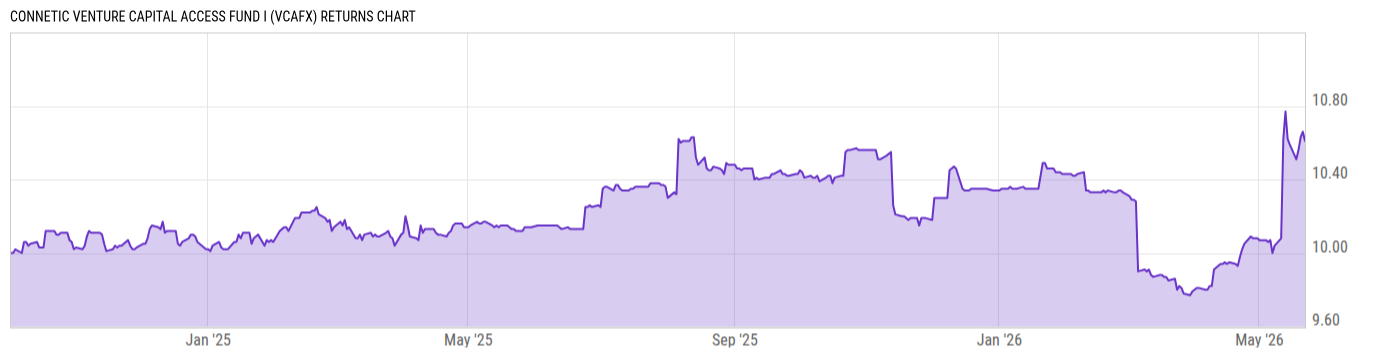
Connetic Venture Capital Access Fund I (VCAFX)
10.36
-0.01
(-0.10%)
USD |
Jun 10 2026
Returns Chart
Key Stats
| Net Expense Ratio | Total Assets Under Management | Weighted Average Dividend Yield | Turnover Ratio (Generic) |
|---|---|---|---|
| 2.84% | 40.86M | -- | -- |
| 1 Year Fund Level Flows | 1 Year Total Returns (Daily) | Annualized Total Returns Since Inception (Daily) | Max Drawdown (Since Inception) |
| -- | 2.07% |
Basic Info
| Investment Strategy | |
| The Fund seeks to generate long-term capital appreciation. The Fund invests in securities that provide exposure to private, venture capital investments. Venture capital is characterized by equity investments in early- through growth-stage startup companies with high growth potential, often in the technology sectors. |
| General | |
| Security Type | Unlisted Closed-End Fund |
| Equity Style | -- |
| Broad Asset Class | Sector Equity |
| Broad Category | Equity |
| Global Peer Group | Equity Other |
| Peer Group | Sector Equity Funds |
| Global Macro | Equity Other |
| US Macro | -- |
| YCharts Categorization | -- |
| YCharts Benchmark | -- |
| Prospectus Objective | Sector Equity Funds |
| Fund Owner Firm Name | Connetic |
| Broad Asset Class Benchmark Index | |
| ^MSWNTR | 100.0% |
Net Fund Flows Versus Peer Group
1 Month
% Rank:
--
157.11M
Peer Group Low
157.11M
Peer Group High
1 Year
% Rank:
--
2.180B
Peer Group Low
2.180B
Peer Group High
3 Months
% Rank:
--
495.40M
Peer Group Low
495.40M
Peer Group High
3 Years
% Rank:
--
3.823B
Peer Group Low
3.823B
Peer Group High
6 Months
% Rank:
--
1.045B
Peer Group Low
1.045B
Peer Group High
5 Years
% Rank:
--
--
Peer Group Low
--
Peer Group High
YTD
% Rank:
--
616.64M
Peer Group Low
616.64M
Peer Group High
10 Years
% Rank:
--
--
Peer Group Low
--
Peer Group High
Date Unavailable
Risk
Performance Versus Peer Group
Annual Total Returns Versus Peers
As of June 11, 2026.
Asset Allocation
As of December 31, 2025.
| Type | % Net |
|---|---|
| Cash | 0.72% |
| Stock | 43.37% |
| Bond | 18.49% |
| Convertible | 0.00% |
| Preferred | 37.50% |
| Other | -0.08% |
Top 10 Holdings
| Name | % Weight | Price | % Change |
|---|---|---|---|
|
Cary Rx Inc FRN
|
15.33% | -- | -- |
|
Get Bizzy Inc
|
10.47% | -- | -- |
| iShares Core MSCI EAFE ETF | 3.98% | 96.94 | 2.18% |
|
Base Social Inc PFD
|
3.77% | -- | -- |
|
Letterhead Inc PFD
|
3.74% | -- | -- |
|
FirstIgnite Ltd
|
2.79% | -- | -- |
|
Venture360 Inc PFD
|
2.27% | -- | -- |
|
MASV Inc
|
2.11% | -- | -- |
|
Ottonomy Inc PFD
|
1.90% | -- | -- |
| Vanguard Emerging Markets Stock Index Fund ETF | 1.82% | 58.71 | 1.72% |
Fees & Availability
| Fees | |
| Actual 12B-1 Fee | -- |
| Actual Management Fee | 0.98% |
| Administration Fee | -- |
| Maximum Front Load | -- |
| Maximum Deferred Load | -- |
| Maximum Redemption Fee | -- |
| General Availability | |
| Available for Insurance Product | No |
| Available for RRSP | No |
| Purchase Details | |
| Open to New Investors |
|
| Minimum Initial Investment | 2500.00 None |
| Minimum Subsequent Investment | 100.00 None |
Basic Info
| Investment Strategy | |
| The Fund seeks to generate long-term capital appreciation. The Fund invests in securities that provide exposure to private, venture capital investments. Venture capital is characterized by equity investments in early- through growth-stage startup companies with high growth potential, often in the technology sectors. |
| General | |
| Security Type | Unlisted Closed-End Fund |
| Equity Style | -- |
| Broad Asset Class | Sector Equity |
| Broad Category | Equity |
| Global Peer Group | Equity Other |
| Peer Group | Sector Equity Funds |
| Global Macro | Equity Other |
| US Macro | -- |
| YCharts Categorization | -- |
| YCharts Benchmark | -- |
| Prospectus Objective | Sector Equity Funds |
| Fund Owner Firm Name | Connetic |
| Broad Asset Class Benchmark Index | |
| ^MSWNTR | 100.0% |
Fundamentals
| General | |
| Distribution Yield | -- |
| Dividend Yield TTM (6-10-26) | 0.00% |
| 30-Day SEC Yield | -- |
| 7-Day SEC Yield | -- |
| Number of Holdings | 124 |
| Stock | |
| Weighted Average PE Ratio | 28.69 |
| Weighted Average Price to Sales Ratio | 5.684 |
| Weighted Average Price to Book Ratio | 6.269 |
| Weighted Median ROE | 58.41% |
| Weighted Median ROA | 8.02% |
| ROI (TTM) | 12.90% |
| Return on Investment (TTM) | 12.90% |
| Earning Yield | 0.0482 |
| LT Debt / Shareholders Equity | 1.114 |
| Number of Equity Holdings | 108 |
| Bond | |
| Yield to Maturity (12-31-25) | -- |
| Effective Duration | -- |
| Average Coupon | -- |
| Calculated Average Quality | -- |
| Effective Maturity | -- |
| Nominal Maturity | -- |
| Number of Bond Holdings | 9 |
As of December 31, 2025
Growth Metrics
| EPS Growth (1Y) | 20.25% |
| EPS Growth (3Y) | 12.55% |
| EPS Growth (5Y) | 15.47% |
| Sales Growth (1Y) | 8.70% |
| Sales Growth (3Y) | 8.79% |
| Sales Growth (5Y) | 10.91% |
| Sales per Share Growth (1Y) | 10.96% |
| Sales per Share Growth (3Y) | 9.49% |
| Operating Cash Flow - Growth Rate (3Y) | 10.23% |
As of December 31, 2025
Fund Details
| Key Dates | |
| Launch Date | 10/2/2024 |
| Last Annual Report Date | -- |
| Last Prospectus Date | 7/29/2025 |
| Attributes | |
| Index Fund | -- |
| Inverse Fund | No |
| Leveraged Fund | -- |
| Fund of Funds | No |
| Currency Hedged Fund | -- |
| Socially Responsible Fund | No |
Top Portfolio Holders
| Name | % Weight |
|---|---|
| Portfolio A | 5.00% |
| Portfolio B | 3.50% |
| Portfolio C | 2.25% |