

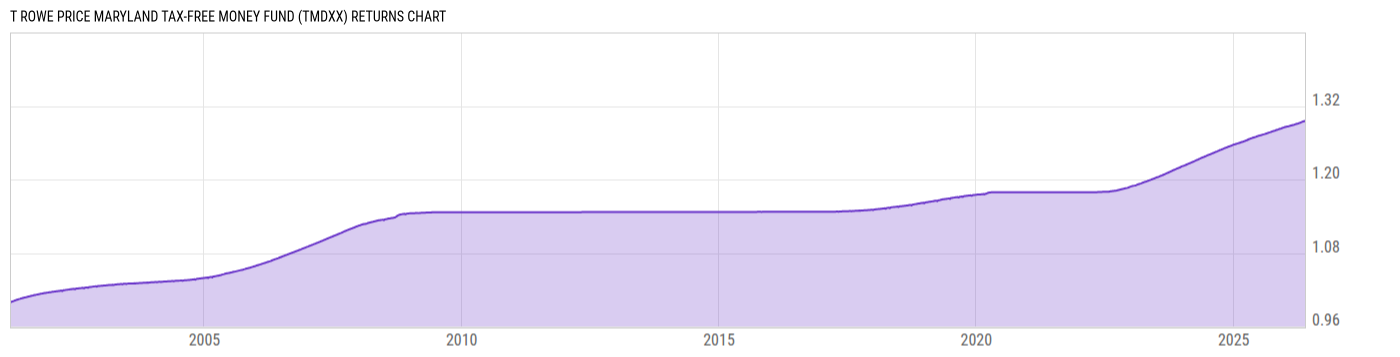
T Rowe Price Maryland Tax-Free Money Fund (TMDXX)
1.00
0.00 (0.00%)
USD |
May 22 2026
Returns Chart
Key Stats
| Net Expense Ratio | Total Assets Under Management | Weighted Average Dividend Yield | Turnover Ratio (Generic) |
|---|---|---|---|
| 0.41% | 106.33M | -- | -- |
| 1 Year Fund Level Flows | 1 Year Total Returns (Daily) | Annualized Total Returns Since Inception (Daily) | Max Drawdown (Since Inception) |
| -1.226M | 2.14% |
Basic Info
| Investment Strategy | |
| The Fund seeks to provide preservation of capital, liquidity, and consistent with these objectives, the highest level of income exempt from Federal and Maryland state and local income taxes. The Fund's weighted average maturity will not exceed 90 days and its share price will be managed to remain stable at $1.00. |
| General | |
| Security Type | Money Market Fund |
| Equity Style | -- |
| Broad Asset Class | Money Market |
| Broad Category | Capital Preservation |
| Global Peer Group | Bond USD Tax Exempt Money Market |
| Peer Group | Other States Tax-Exempt Money Market Fds |
| Global Macro | Bond HC |
| US Macro | Tax-Exempt Money Market Funds |
| YCharts Categorization | -- |
| YCharts Benchmark | -- |
| Prospectus Objective | Other States Tax-Exempt Money Market Fds |
| Fund Owner Firm Name | T. Rowe Price |
| Broad Asset Class Benchmark Index | |
| ^BBUTB13MTR | 100.0% |
Net Fund Flows Versus Peer Group
1 Month
% Rank:
94
-47737.00
Peer Group Low
51.50M
Peer Group High
1 Year
% Rank:
94
-1.226M
-1.226M
Peer Group Low
230.62M
Peer Group High
3 Months
% Rank:
94
-2.127M
Peer Group Low
376.72M
Peer Group High
3 Years
% Rank:
94
593088.0
Peer Group Low
1.082B
Peer Group High
6 Months
% Rank:
94
2.630M
Peer Group Low
100.49M
Peer Group High
5 Years
% Rank:
94
2.916M
Peer Group Low
1.175B
Peer Group High
YTD
% Rank:
94
-3.460M
Peer Group Low
29.23M
Peer Group High
10 Years
% Rank:
94
-41.37M
Peer Group Low
1.747B
Peer Group High
Date Unavailable
Risk
Performance Versus Peer Group
Annual Total Returns Versus Peers
As of May 23, 2026.
Asset Allocation
As of March 31, 2026.
| Type | % Net |
|---|---|
| Cash | 0.00% |
| Stock | 0.00% |
| Bond | 100.0% |
| Convertible | 0.00% |
| Preferred | 0.00% |
| Other | 0.00% |
Top 10 Holdings
| Name | % Weight | Price | % Change |
|---|---|---|---|
| MARYLAND ST ECONOMIC DEV CORP REV MD 1.600 02/15/2043 | 5.06% | 100.00 | 0.00% |
| HOWARD CNTY MD HSG COMMN REV MD 1.620 12/01/2062 | 4.69% | 100.00 | 0.00% |
| MARYLAND ST HEALTH & HIGHER EDL FACS AUTH REV MD 1.800 04/01/2035 | 4.62% | 100.00 | 0.00% |
| MARYLAND ST HEALTH & HIGHER EDL FACS AUTH REV MD 1.590 06/01/2042 | 4.57% | 100.04 | 0.00% |
| MARYLAND ST HEALTH & HIGHER EDL FACS AUTH REV MD 1.650 07/01/2036 | 4.57% | 100.00 | 0.00% |
| MONTGOMERY CNTY MD REV MD 12/01/2041 | 4.41% | 99.94 | 0.01% |
| TENDER OPT BD TR RCPTS / CTFS VAR STS DC 07/15/2060 | 4.36% | -- | -- |
| MARYLAND ST CMNTY DEV ADMIN DEPT HSG & CMNTY DEV MD 1.700 12/01/2037 | 4.26% | 100.00 | 0.00% |
| MARYLAND ST CMNTY DEV ADMIN DEPT HSG & CMNTY DEV MD 1.660 03/01/2041 | 4.25% | 100.00 | 0.00% |
| MARYLAND ST HEALTH & HIGHER EDL FACS AUTH REV MD 2.000 07/01/2041 | 3.40% | 100.00 | 0.00% |
Fees & Availability
| Fees | |
| Actual 12B-1 Fee | -- |
| Actual Management Fee | -- |
| Administration Fee | -- |
| Maximum Front Load | -- |
| Maximum Deferred Load | -- |
| Maximum Redemption Fee | -- |
| General Availability | |
| Available for Insurance Product | No |
| Available for RRSP | No |
| Purchase Details | |
| Open to New Investors |
|
| Minimum Initial Investment | 2500.00 None |
| Minimum Subsequent Investment | 100.00 None |
Basic Info
| Investment Strategy | |
| The Fund seeks to provide preservation of capital, liquidity, and consistent with these objectives, the highest level of income exempt from Federal and Maryland state and local income taxes. The Fund's weighted average maturity will not exceed 90 days and its share price will be managed to remain stable at $1.00. |
| General | |
| Security Type | Money Market Fund |
| Equity Style | -- |
| Broad Asset Class | Money Market |
| Broad Category | Capital Preservation |
| Global Peer Group | Bond USD Tax Exempt Money Market |
| Peer Group | Other States Tax-Exempt Money Market Fds |
| Global Macro | Bond HC |
| US Macro | Tax-Exempt Money Market Funds |
| YCharts Categorization | -- |
| YCharts Benchmark | -- |
| Prospectus Objective | Other States Tax-Exempt Money Market Fds |
| Fund Owner Firm Name | T. Rowe Price |
| Broad Asset Class Benchmark Index | |
| ^BBUTB13MTR | 100.0% |
Fundamentals
| General | |
| Distribution Yield | -- |
| Dividend Yield TTM (5-22-26) | 2.12% |
| 30-Day SEC Yield | -- |
| 7-Day SEC Yield (4-30-26) | 2.80% |
| Number of Holdings | 78 |
| Bond | |
| Yield to Maturity (3-31-26) | -- |
| Effective Duration | -- |
| Average Coupon | -- |
| Calculated Average Quality | -- |
| Effective Maturity | -- |
| Nominal Maturity | -- |
| Number of Bond Holdings | 78 |
As of March 31, 2026
Fund Details
| Key Dates | |
| Launch Date | 3/30/2001 |
| Last Annual Report Date | 2/28/2025 |
| Last Prospectus Date | 5/1/2025 |
| Share Classes | |
| TWNXX | Inst |
| Attributes | |
| Index Fund | -- |
| Inverse Fund | No |
| Leveraged Fund | -- |
| Fund of Funds | No |
| Currency Hedged Fund | -- |
| Socially Responsible Fund | No |
Top Portfolio Holders
| Name | % Weight |
|---|---|
| Portfolio A | 5.00% |
| Portfolio B | 3.50% |
| Portfolio C | 2.25% |