

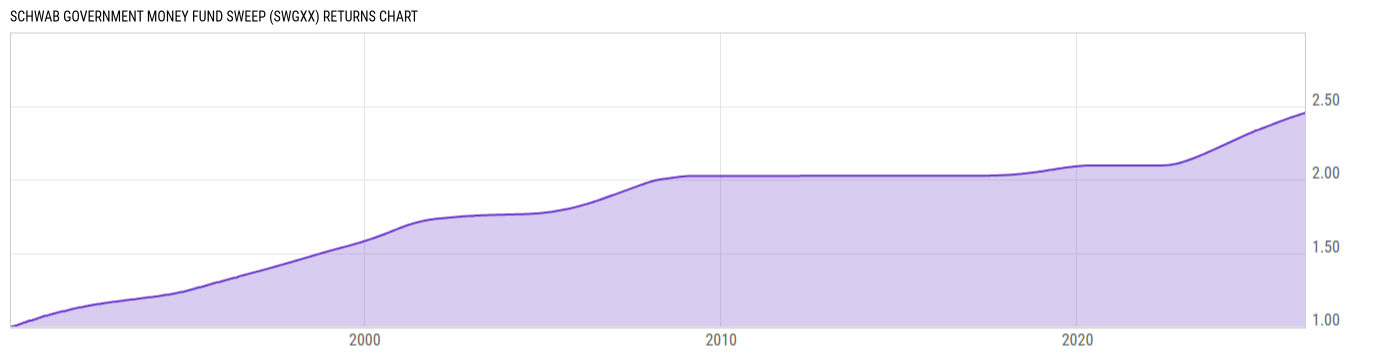
Schwab Government Money Fund Sweep (SWGXX)
1.00
0.00 (0.00%)
USD |
Jun 08 2026
Returns Chart
Key Stats
| Net Expense Ratio | Total Assets Under Management | Weighted Average Dividend Yield | Turnover Ratio (Generic) |
|---|---|---|---|
| 0.44% | 91.40B | -- | -- |
| 1 Year Fund Level Flows | 1 Year Total Returns (Daily) | Annualized Total Returns Since Inception (Daily) | Max Drawdown (Since Inception) |
| 7.217B | 3.62% |
Basic Info
| Investment Strategy | |
| The Fund seeks the highest current income consistent with stability of capital and liquidity. Under normal circumstances, the Fund will invest at least 99.5% of its total assets in cash, U.S. government securities and/or repurchase agreements that are collateralized fully by cash and/or U.S. government securities. |
| General | |
| Security Type | Money Market Fund |
| Equity Style | -- |
| Broad Asset Class | Money Market |
| Broad Category | Capital Preservation |
| Global Peer Group | Money Market USD |
| Peer Group | U.S. Government Money Market Funds |
| Global Macro | Money Market HC |
| US Macro | Taxable Money Market Funds |
| YCharts Categorization | -- |
| YCharts Benchmark | -- |
| Prospectus Objective | U.S. Government Money Market Funds |
| Fund Owner Firm Name | Charles Schwab |
| Broad Asset Class Benchmark Index | |
| ^BBUTB13MTR | 100.0% |
Net Fund Flows Versus Peer Group
1 Month
% Rank:
8
-3.984B
Peer Group Low
5.094B
Peer Group High
1 Year
% Rank:
8
7.217B
-5.811B
Peer Group Low
44.03B
Peer Group High
3 Months
% Rank:
95
-6.010B
Peer Group Low
13.98B
Peer Group High
3 Years
% Rank:
7
-3.385B
Peer Group Low
149.96B
Peer Group High
6 Months
% Rank:
7
-13.14B
Peer Group Low
18.91B
Peer Group High
5 Years
% Rank:
6
-37.54B
Peer Group Low
190.74B
Peer Group High
YTD
% Rank:
92
-9.925B
Peer Group Low
8.301B
Peer Group High
10 Years
% Rank:
9
-14.28B
Peer Group Low
341.23B
Peer Group High
Date Unavailable
Risk
Performance Versus Peer Group
Annual Total Returns Versus Peers
As of June 09, 2026.
Asset Allocation
As of April 30, 2026.
| Type | % Net |
|---|---|
| Cash | 59.69% |
| Stock | 0.00% |
| Bond | 40.54% |
| Convertible | 0.00% |
| Preferred | 0.00% |
| Other | -0.23% |
Top 10 Holdings
| Name | % Weight | Price | % Change |
|---|---|---|---|
|
JP MORGAN SECURITIES LLC REPO
|
14.52% | -- | -- |
|
WELLS FARGO SECURITIES LLC REPO
|
13.06% | -- | -- |
|
FIXED INCOME CLEARING CORP REPO
|
12.47% | -- | -- |
|
GOLDMAN SACHS & CO LLC REPO
|
7.63% | -- | -- |
|
RBC DOMINION SECURITIES INC REPO
|
2.27% | -- | -- |
|
WELLS FARGO BANK NA REPO
|
1.92% | -- | -- |
|
SMBC NIKKO SECURITIES AMERICA INC REPO
|
1.46% | -- | -- |
|
TRUIST BANK REPO
|
0.94% | -- | -- |
|
DAIWA CAPITAL MARKETS AMERICA INC REPO
|
0.79% | -- | -- |
|
MUFG SECURITIES AMERICAS INC REPO
|
0.73% | -- | -- |
Fees & Availability
| Fees | |
| Actual 12B-1 Fee | -- |
| Actual Management Fee | 0.18% |
| Administration Fee | -- |
| Maximum Front Load | -- |
| Maximum Deferred Load | -- |
| Maximum Redemption Fee | -- |
| General Availability | |
| Available for Insurance Product | No |
| Available for RRSP | No |
| Purchase Details | |
| Open to New Investors |
|
| Minimum Initial Investment | 0.00 None |
| Minimum Subsequent Investment | 0.00 None |
Basic Info
| Investment Strategy | |
| The Fund seeks the highest current income consistent with stability of capital and liquidity. Under normal circumstances, the Fund will invest at least 99.5% of its total assets in cash, U.S. government securities and/or repurchase agreements that are collateralized fully by cash and/or U.S. government securities. |
| General | |
| Security Type | Money Market Fund |
| Equity Style | -- |
| Broad Asset Class | Money Market |
| Broad Category | Capital Preservation |
| Global Peer Group | Money Market USD |
| Peer Group | U.S. Government Money Market Funds |
| Global Macro | Money Market HC |
| US Macro | Taxable Money Market Funds |
| YCharts Categorization | -- |
| YCharts Benchmark | -- |
| Prospectus Objective | U.S. Government Money Market Funds |
| Fund Owner Firm Name | Charles Schwab |
| Broad Asset Class Benchmark Index | |
| ^BBUTB13MTR | 100.0% |
Fundamentals
| General | |
| Distribution Yield | -- |
| Dividend Yield TTM (6-8-26) | 3.61% |
| 30-Day SEC Yield (1-31-25) | 4.00% |
| 7-Day SEC Yield (5-31-26) | 3.24% |
| Number of Holdings | 266 |
| Bond | |
| Yield to Maturity (4-30-26) | -- |
| Effective Duration | -- |
| Average Coupon | -- |
| Calculated Average Quality | -- |
| Effective Maturity | -- |
| Nominal Maturity | -- |
| Number of Bond Holdings | 205 |
As of April 30, 2026
Fund Details
Top Portfolio Holders
| Name | % Weight |
|---|---|
| Portfolio A | 5.00% |
| Portfolio B | 3.50% |
| Portfolio C | 2.25% |