

UBS Select Treasury Preferred Fund (STPXX)
1.00
0.00 (0.00%)
USD |
Jun 09 2026
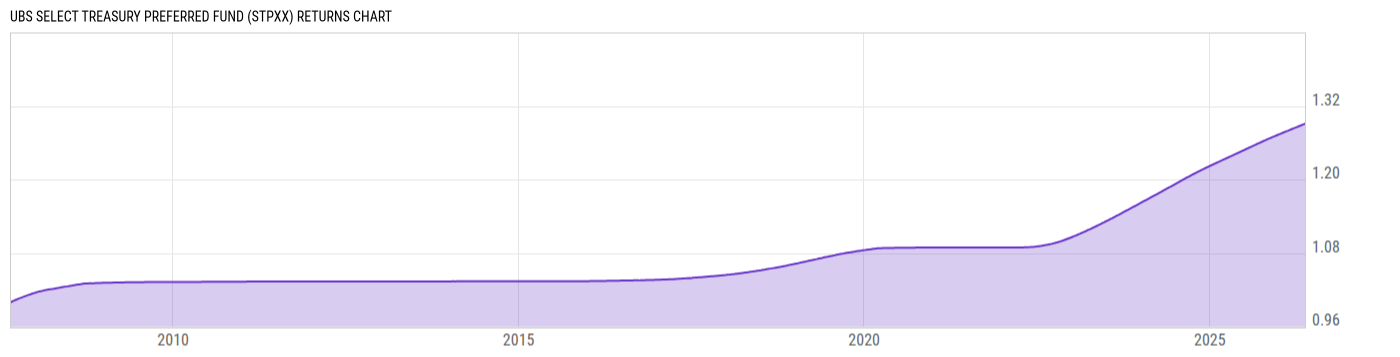
Returns Chart
Key Stats
| Net Expense Ratio | Total Assets Under Management | Weighted Average Dividend Yield | Turnover Ratio (Generic) |
|---|---|---|---|
| 0.14% | 40.18B | -- | -- |
| 1 Year Fund Level Flows | 1 Year Total Returns (Daily) | Annualized Total Returns Since Inception (Daily) | Max Drawdown (Since Inception) |
| -4.105B | 3.82% |
Basic Info
| Investment Strategy | |
| The Fund seeks maximum current income consistent with liquidity and preservation of capital, by normally investing at least 80% of its assets in securities issued by the US Treasury and related repurchase agreements. |
| General | |
| Security Type | Money Market Fund |
| Equity Style | -- |
| Broad Asset Class | Money Market |
| Broad Category | Capital Preservation |
| Global Peer Group | Money Market USD |
| Peer Group | Instl U.S. Treasury Money Market Funds |
| Global Macro | Money Market HC |
| US Macro | Taxable Money Market Funds |
| YCharts Categorization | -- |
| YCharts Benchmark | -- |
| Prospectus Objective | Instl U.S. Treasury Money Market Funds |
| Fund Owner Firm Name | UBS Asset Management |
| Broad Asset Class Benchmark Index | |
| ^BBUTB13MTR | 100.0% |
Net Fund Flows Versus Peer Group
1 Month
% Rank:
64
-2.904B
Peer Group Low
28.46B
Peer Group High
1 Year
% Rank:
87
-4.105B
-7.862B
Peer Group Low
73.51B
Peer Group High
3 Months
% Rank:
88
-6.979B
Peer Group Low
19.39B
Peer Group High
3 Years
% Rank:
57
-6.841B
Peer Group Low
195.27B
Peer Group High
6 Months
% Rank:
82
-12.59B
Peer Group Low
44.22B
Peer Group High
5 Years
% Rank:
58
-16.16B
Peer Group Low
206.78B
Peer Group High
YTD
% Rank:
67
-8.792B
Peer Group Low
31.74B
Peer Group High
10 Years
% Rank:
49
-2.644B
Peer Group Low
288.62B
Peer Group High
Date Unavailable
Risk
Performance Versus Peer Group
Annual Total Returns Versus Peers
As of June 10, 2026.
Asset Allocation
As of October 31, 2025.
| Type | % Net |
|---|---|
| Cash | 0.00% |
| Stock | 0.00% |
| Bond | 0.00% |
| Convertible | 0.00% |
| Preferred | 0.00% |
| Other | 100.0% |
Top 2 Holdings
| Name | % Weight | Price | % Change |
|---|---|---|---|
|
UBS Select Treasury Institutional Fund
|
100.4% | -- | -- |
|
Other Assets less Liabilities
|
-0.39% | -- | -- |
Fees & Availability
| Fees | |
| Actual 12B-1 Fee | -- |
| Actual Management Fee | 0.14% |
| Administration Fee | 8.79M% |
| Maximum Front Load | -- |
| Maximum Deferred Load | -- |
| Maximum Redemption Fee | -- |
| General Availability | |
| Available for Insurance Product | No |
| Available for RRSP | No |
| Purchase Details | |
| Open to New Investors |
|
| Minimum Initial Investment | 50.00M None |
| Minimum Subsequent Investment | 0.00 None |
Basic Info
| Investment Strategy | |
| The Fund seeks maximum current income consistent with liquidity and preservation of capital, by normally investing at least 80% of its assets in securities issued by the US Treasury and related repurchase agreements. |
| General | |
| Security Type | Money Market Fund |
| Equity Style | -- |
| Broad Asset Class | Money Market |
| Broad Category | Capital Preservation |
| Global Peer Group | Money Market USD |
| Peer Group | Instl U.S. Treasury Money Market Funds |
| Global Macro | Money Market HC |
| US Macro | Taxable Money Market Funds |
| YCharts Categorization | -- |
| YCharts Benchmark | -- |
| Prospectus Objective | Instl U.S. Treasury Money Market Funds |
| Fund Owner Firm Name | UBS Asset Management |
| Broad Asset Class Benchmark Index | |
| ^BBUTB13MTR | 100.0% |
Fundamentals
| General | |
| Distribution Yield | -- |
| Dividend Yield TTM (6-9-26) | 3.86% |
| 30-Day SEC Yield | -- |
| 7-Day SEC Yield (4-30-26) | 3.57% |
| Number of Holdings | 2 |
Fund Details
| Key Dates | |
| Launch Date | 8/28/2007 |
| Last Annual Report Date | 4/30/2025 |
| Last Prospectus Date | 8/28/2025 |
| Share Classes | |
| SETXX | Single Share Class |
| Attributes | |
| Index Fund | -- |
| Inverse Fund | No |
| Leveraged Fund | -- |
| Fund of Funds | No |
| Currency Hedged Fund | -- |
| Socially Responsible Fund | No |
Top Portfolio Holders
| Name | % Weight |
|---|---|
| Portfolio A | 5.00% |
| Portfolio B | 3.50% |
| Portfolio C | 2.25% |