

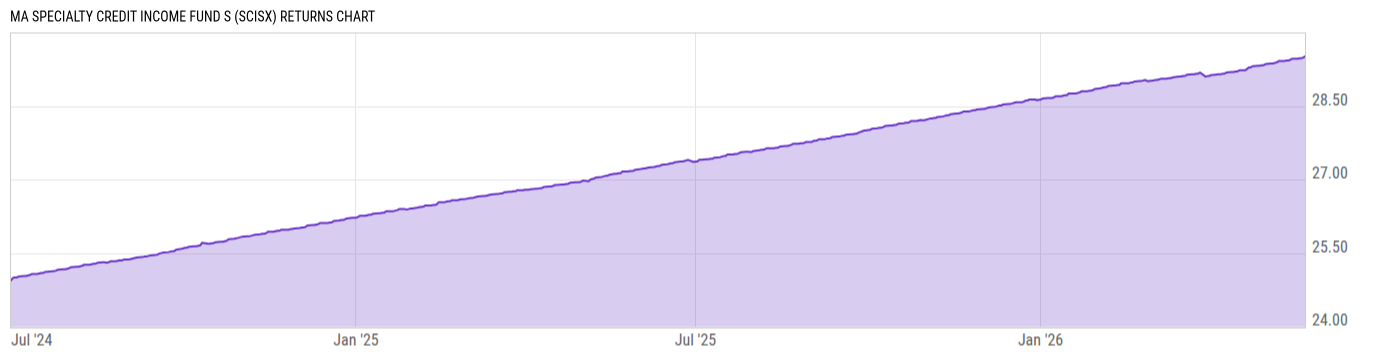
MA Specialty Credit Income Fund S (SCISX)
24.85
+0.02
(+0.08%)
USD |
May 22 2026
Returns Chart
Key Stats
| Net Expense Ratio | Total Assets Under Management | Weighted Average Dividend Yield | Turnover Ratio (Generic) |
|---|---|---|---|
| 2.41% | 165.66M | -- | 44.00% |
| 1 Year Fund Level Flows | 1 Year Total Returns (Daily) | Annualized Total Returns Since Inception (Daily) | Max Drawdown (Since Inception) |
| -- | 8.78% |
Basic Info
| Investment Strategy | |
| The Fund seeks to generate attractive current income from a differentiated portfolio of credit investments, while maintaining capital stability and selectively seeking opportunities for capital appreciation. It will invest at least 80% of its assets in private loans, credit facilities, and credit-related investments. |
| General | |
| Security Type | Unlisted Closed-End Fund |
| Equity Style | -- |
| Broad Asset Class | Taxable Bond |
| Broad Category | Fixed Income |
| Global Peer Group | Bond USD |
| Peer Group | General Bond Funds |
| Global Macro | Bond HC |
| US Macro | General Domestic Taxable Fixed Income Funds |
| YCharts Categorization | -- |
| YCharts Benchmark | -- |
| Prospectus Objective | General Bond Funds |
| Fund Owner Firm Name | MA Asset Management |
| Broad Asset Class Benchmark Index | |
| ^BBUSATR | 100.0% |
Net Fund Flows Versus Peer Group
1 Month
% Rank:
--
-3.511B
Peer Group Low
288.35M
Peer Group High
1 Year
% Rank:
--
-641.24M
Peer Group Low
13.23B
Peer Group High
3 Months
% Rank:
--
-2.235B
Peer Group Low
1.456B
Peer Group High
3 Years
% Rank:
--
-12.70B
Peer Group Low
18.00B
Peer Group High
6 Months
% Rank:
--
-3.509B
Peer Group Low
2.976B
Peer Group High
5 Years
% Rank:
--
-1.455B
Peer Group Low
49.86B
Peer Group High
YTD
% Rank:
--
-2.080B
Peer Group Low
2.002B
Peer Group High
10 Years
% Rank:
--
-1.866B
Peer Group Low
81.23B
Peer Group High
Date Unavailable
Risk
Performance Versus Peer Group
Annual Total Returns Versus Peers
As of May 23, 2026.
Asset Allocation
As of December 31, 2025.
| Type | % Net |
|---|---|
| Cash | 0.72% |
| Stock | 15.83% |
| Bond | 89.72% |
| Convertible | 0.00% |
| Preferred | 0.00% |
| Other | -6.27% |
Top 10 Holdings
| Name | % Weight | Price | % Change |
|---|---|---|---|
|
ABL Term HFD 15.000% 30-Apr-2027
|
19.22% | -- | -- |
|
ABL Term GP FRN 27-Sep-2028
|
16.10% | -- | -- |
|
MSM SLPP Onshore LP
|
15.83% | -- | -- |
|
ABL Term VI 13.500% 20-Nov-2027
|
9.64% | -- | -- |
|
MONROE CAPITAL INCOME PLUS ABS FUNDING, LLC 3 C FLT
|
9.61% | -- | -- |
|
HFD Funded FRN 24-Oct-2026
|
8.74% | -- | -- |
|
Jcp Warehouse FRN 22-Sep-2030
|
7.69% | -- | -- |
|
ABL Revolver RF FRN 15-Apr-2028
|
6.23% | -- | -- |
|
BE OLD I LLC
|
3.51% | -- | -- |
|
ABL Revolver IHC FRN 30-Jun-2026
|
2.76% | -- | -- |
Fees & Availability
| Fees | |
| Actual 12B-1 Fee | -- |
| Actual Management Fee | 0.01% |
| Administration Fee | 201.1K% |
| Maximum Front Load | -- |
| Maximum Deferred Load | -- |
| Maximum Redemption Fee | -- |
| General Availability | |
| Available for Insurance Product | No |
| Available for RRSP | No |
| Purchase Details | |
| Open to New Investors |
|
| Minimum Initial Investment | 1.00M None |
| Minimum Subsequent Investment | 0.00 None |
Basic Info
| Investment Strategy | |
| The Fund seeks to generate attractive current income from a differentiated portfolio of credit investments, while maintaining capital stability and selectively seeking opportunities for capital appreciation. It will invest at least 80% of its assets in private loans, credit facilities, and credit-related investments. |
| General | |
| Security Type | Unlisted Closed-End Fund |
| Equity Style | -- |
| Broad Asset Class | Taxable Bond |
| Broad Category | Fixed Income |
| Global Peer Group | Bond USD |
| Peer Group | General Bond Funds |
| Global Macro | Bond HC |
| US Macro | General Domestic Taxable Fixed Income Funds |
| YCharts Categorization | -- |
| YCharts Benchmark | -- |
| Prospectus Objective | General Bond Funds |
| Fund Owner Firm Name | MA Asset Management |
| Broad Asset Class Benchmark Index | |
| ^BBUSATR | 100.0% |
Fundamentals
| General | |
| Distribution Yield | -- |
| Dividend Yield TTM (5-21-26) | 9.40% |
| 30-Day SEC Yield | -- |
| 7-Day SEC Yield | -- |
| Number of Holdings | 23 |
| Stock | |
| Weighted Average PE Ratio | -- |
| Weighted Average Price to Sales Ratio | -- |
| Weighted Average Price to Book Ratio | -- |
| Weighted Median ROE | -- |
| Weighted Median ROA | -- |
| ROI (TTM) | -- |
| Return on Investment (TTM) | -- |
| Earning Yield | -- |
| LT Debt / Shareholders Equity | -- |
| Number of Equity Holdings | 1 |
| Bond | |
| Yield to Maturity (12-31-25) | 8.52% |
| Effective Duration | -- |
| Average Coupon | 13.54% |
| Calculated Average Quality | 4.054 |
| Effective Maturity | 2.666 |
| Nominal Maturity | 2.666 |
| Number of Bond Holdings | 18 |
As of December 31, 2025
Growth Metrics
| EPS Growth (1Y) | -- |
| EPS Growth (3Y) | -- |
| EPS Growth (5Y) | -- |
| Sales Growth (1Y) | -- |
| Sales Growth (3Y) | -- |
| Sales Growth (5Y) | -- |
| Sales per Share Growth (1Y) | -- |
| Sales per Share Growth (3Y) | -- |
| Operating Cash Flow - Growth Rate (3Y) | -- |
As of December 31, 2025
Fund Details
| Key Dates | |
| Launch Date | 7/1/2024 |
| Last Annual Report Date | 12/31/2025 |
| Last Prospectus Date | 10/31/2025 |
| Attributes | |
| Index Fund | -- |
| Inverse Fund | No |
| Leveraged Fund |
|
| Fund of Funds | No |
| Currency Hedged Fund | -- |
| Socially Responsible Fund | No |
Top Portfolio Holders
| Name | % Weight |
|---|---|
| Portfolio A | 5.00% |
| Portfolio B | 3.50% |
| Portfolio C | 2.25% |