

HSBC US Government Money Market Fund Y (RGYXX)
1.00
0.00 (0.00%)
USD |
May 27 2026
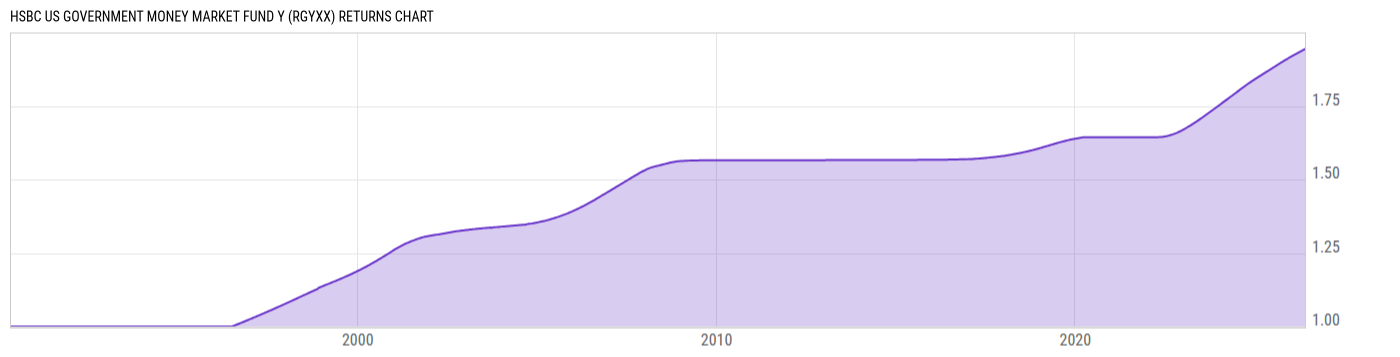
Returns Chart
Key Stats
| Net Expense Ratio | Total Assets Under Management | Weighted Average Dividend Yield | Turnover Ratio (Generic) |
|---|---|---|---|
| 0.24% | 39.91B | -- | -- |
| 1 Year Fund Level Flows | 1 Year Total Returns (Daily) | Annualized Total Returns Since Inception (Daily) | Max Drawdown (Since Inception) |
| 895.71M | 3.84% |
Basic Info
| Investment Strategy | |
| The Fund seeks to provide liquidity and as high a level of current income as is consistent with the preservation of capital. The Fund seeks to achieve its investment objective by investing at least 80% of its net assets in obligations issued or guaranteed by the U.S. government, its agencies or instrumentalities. |
| General | |
| Security Type | Money Market Fund |
| Equity Style | -- |
| Broad Asset Class | Money Market |
| Broad Category | Capital Preservation |
| Global Peer Group | Money Market USD |
| Peer Group | Instl U.S. Government Money Market Funds |
| Global Macro | Money Market HC |
| US Macro | Taxable Money Market Funds |
| YCharts Categorization | -- |
| YCharts Benchmark | -- |
| Prospectus Objective | Instl U.S. Government Money Market Funds |
| Fund Owner Firm Name | HSBC |
| Broad Asset Class Benchmark Index | |
| ^BBUTB13MTR | 100.0% |
Net Fund Flows Versus Peer Group
1 Month
% Rank:
65
-16.07B
Peer Group Low
8.962B
Peer Group High
1 Year
% Rank:
50
895.71M
-6.744B
Peer Group Low
45.39B
Peer Group High
3 Months
% Rank:
62
-25.10B
Peer Group Low
11.15B
Peer Group High
3 Years
% Rank:
37
-5.676B
Peer Group Low
155.04B
Peer Group High
6 Months
% Rank:
31
-10.36B
Peer Group Low
46.36B
Peer Group High
5 Years
% Rank:
55
-18.90B
Peer Group Low
186.38B
Peer Group High
YTD
% Rank:
68
-23.69B
Peer Group Low
17.86B
Peer Group High
10 Years
% Rank:
46
-13.75B
Peer Group Low
339.01B
Peer Group High
Date Unavailable
Risk
Performance Versus Peer Group
Annual Total Returns Versus Peers
As of May 28, 2026.
Asset Allocation
As of March 31, 2026.
| Type | % Net |
|---|---|
| Cash | 30.84% |
| Stock | 0.00% |
| Bond | 70.69% |
| Convertible | 0.00% |
| Preferred | 0.00% |
| Other | -1.53% |
Top 10 Holdings
| Name | % Weight | Price | % Change |
|---|---|---|---|
|
Fixed Income Clearing Corp Repo
|
18.51% | -- | -- |
| State Street US Government Money Market Fund Prem | 3.64% | 1.00 | 0.00% |
|
Credit Agricole Corporate and Investment Bank SA Repo
|
1.85% | -- | -- |
| United States of America USGB 0.0 05/28/2026 FIX USD Government | 1.79% | 100.00 | 0.01% |
| Federated Hermes Government Obligations Fd Premier | 1.72% | 1.00 | 0.00% |
| United States of America USGB 0.0 06/11/2026 FIX USD Government | 1.72% | 99.86 | 0.01% |
|
Wells Fargo Securities LLC Repo
|
1.63% | -- | -- |
|
Citigroup Global Markets Inc Repo
|
1.63% | -- | -- |
| United States of America USGB 0.0 08/06/2026 FIX USD Government | 1.50% | 99.30 | 0.01% |
| United States of America USGB 3.875 03/31/2027 FIX USD Government | 1.31% | 100.03 | -0.02% |
Fees & Availability
| Fees | |
| Actual 12B-1 Fee | -- |
| Actual Management Fee | 0.10% |
| Administration Fee | 2.62M% |
| Maximum Front Load | -- |
| Maximum Deferred Load | -- |
| Maximum Redemption Fee | -- |
| General Availability | |
| Available for Insurance Product | No |
| Available for RRSP | No |
| Purchase Details | |
| Open to New Investors |
|
| Minimum Initial Investment | 1.00M None |
| Minimum Subsequent Investment | 0.00 None |
Basic Info
| Investment Strategy | |
| The Fund seeks to provide liquidity and as high a level of current income as is consistent with the preservation of capital. The Fund seeks to achieve its investment objective by investing at least 80% of its net assets in obligations issued or guaranteed by the U.S. government, its agencies or instrumentalities. |
| General | |
| Security Type | Money Market Fund |
| Equity Style | -- |
| Broad Asset Class | Money Market |
| Broad Category | Capital Preservation |
| Global Peer Group | Money Market USD |
| Peer Group | Instl U.S. Government Money Market Funds |
| Global Macro | Money Market HC |
| US Macro | Taxable Money Market Funds |
| YCharts Categorization | -- |
| YCharts Benchmark | -- |
| Prospectus Objective | Instl U.S. Government Money Market Funds |
| Fund Owner Firm Name | HSBC |
| Broad Asset Class Benchmark Index | |
| ^BBUTB13MTR | 100.0% |
Fundamentals
| General | |
| Distribution Yield | -- |
| Dividend Yield TTM (5-27-26) | 3.82% |
| 30-Day SEC Yield | -- |
| 7-Day SEC Yield (4-30-26) | 3.53% |
| Number of Holdings | 162 |
| Bond | |
| Yield to Maturity (3-31-26) | -- |
| Effective Duration | -- |
| Average Coupon | -- |
| Calculated Average Quality | -- |
| Effective Maturity | -- |
| Nominal Maturity | -- |
| Number of Bond Holdings | 123 |
As of March 31, 2026
Fund Details
Top Portfolio Holders
| Name | % Weight |
|---|---|
| Portfolio A | 5.00% |
| Portfolio B | 3.50% |
| Portfolio C | 2.25% |