

RBC Investment Savings Account RT Series F (RBF2011)
10.00
0.00 (0.00%)
CAD |
Jun 08 2026
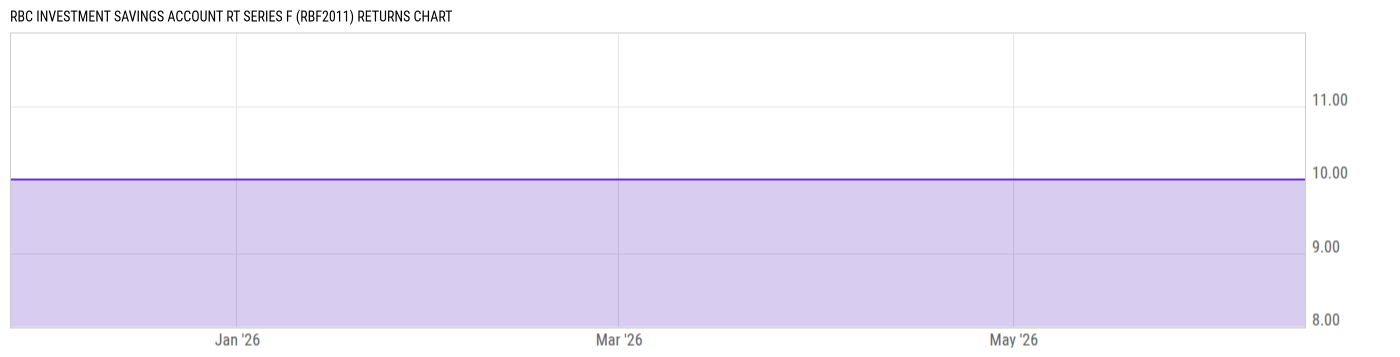
Returns Chart
Key Stats
| Net Expense Ratio | Total Assets Under Management | Weighted Average Dividend Yield | Turnover Ratio (Generic) |
|---|---|---|---|
| -- | -- | -- | -- |
| 1 Year Fund Level Flows | 1 Year Total Returns (Daily) | Annualized Total Returns Since Inception (Daily) | Max Drawdown (Since Inception) |
| -- | -- |
Basic Info
| Investment Strategy | |
| Grow your savings in a product that pays a competitive interest rate and enjoy the security of having your money held in a CDIC eligible bank product. |
| General | |
| Security Type | Money Market Fund |
| Equity Style | -- |
| Broad Asset Class | Money Market |
| Broad Category | Capital Preservation |
| Global Peer Group | Money Market CAD |
| Peer Group | Canadian Money Market |
| Global Macro | Money Market HC |
| US Macro | -- |
| YCharts Categorization | -- |
| YCharts Benchmark | -- |
| Prospectus Objective | -- |
| Fund Owner Firm Name | RBC |
| Broad Asset Class Benchmark Index | |
| ^SPTSX60TR | 100.0% |
Net Fund Flows Versus Peer Group
1 Month
% Rank:
--
-165.75M
Peer Group Low
206.56M
Peer Group High
1 Year
% Rank:
--
-1.304B
Peer Group Low
2.375B
Peer Group High
3 Months
% Rank:
--
-353.73M
Peer Group Low
521.54M
Peer Group High
3 Years
% Rank:
--
-2.614B
Peer Group Low
5.357B
Peer Group High
6 Months
% Rank:
--
-692.95M
Peer Group Low
727.75M
Peer Group High
5 Years
% Rank:
--
-267.03M
Peer Group Low
6.768B
Peer Group High
YTD
% Rank:
--
-582.84M
Peer Group Low
675.51M
Peer Group High
10 Years
% Rank:
--
-682.24M
Peer Group Low
6.768B
Peer Group High
Date Unavailable
Risk
Performance Versus Peer Group
Annual Total Returns Versus Peers
As of June 10, 2026.
Asset Allocation
| Type | % Net |
|---|
Top Holdings
| Name | % Weight | Price | % Change |
|---|---|---|---|
| -- | -- | -- | -- |
| -- | -- | -- | -- |
| -- | -- | -- | -- |
| -- | -- | -- | -- |
| -- | -- | -- | -- |
Fees & Availability
| Fees | |
| Actual 12B-1 Fee | -- |
| Actual Management Fee | -- |
| Administration Fee | -- |
| Maximum Front Load | -- |
| Maximum Deferred Load | -- |
| Maximum Redemption Fee | -- |
| General Availability | |
| Available for Insurance Product | No |
| Available for RRSP | No |
| Purchase Details | |
| Open to New Investors |
|
| Minimum Initial Investment | 0.00 None |
| Minimum Subsequent Investment | 0.00 None |
Basic Info
| Investment Strategy | |
| Grow your savings in a product that pays a competitive interest rate and enjoy the security of having your money held in a CDIC eligible bank product. |
| General | |
| Security Type | Money Market Fund |
| Equity Style | -- |
| Broad Asset Class | Money Market |
| Broad Category | Capital Preservation |
| Global Peer Group | Money Market CAD |
| Peer Group | Canadian Money Market |
| Global Macro | Money Market HC |
| US Macro | -- |
| YCharts Categorization | -- |
| YCharts Benchmark | -- |
| Prospectus Objective | -- |
| Fund Owner Firm Name | RBC |
| Broad Asset Class Benchmark Index | |
| ^SPTSX60TR | 100.0% |
Fundamentals
| General | |
| Distribution Yield | -- |
| Dividend Yield TTM (6-8-26) | 0.00% |
| 30-Day SEC Yield | -- |
| 7-Day SEC Yield | -- |
| Number of Holdings | -- |
Fund Details
| Key Dates | |
| Launch Date | 7/6/2009 |
| Last Annual Report Date | -- |
| Last Prospectus Date | -- |
| Share Classes | |
| RBF2010 | Commission-based Advice |
| RBF2012 | Do-It-Yourself |
| RBF2013 | Fee-based Advice |
| Attributes | |
| Index Fund | -- |
| Inverse Fund | No |
| Leveraged Fund | -- |
| Fund of Funds | No |
| Currency Hedged Fund | -- |
| Socially Responsible Fund | No |
Top Portfolio Holders
| Name | % Weight |
|---|---|
| Portfolio A | 5.00% |
| Portfolio B | 3.50% |
| Portfolio C | 2.25% |