

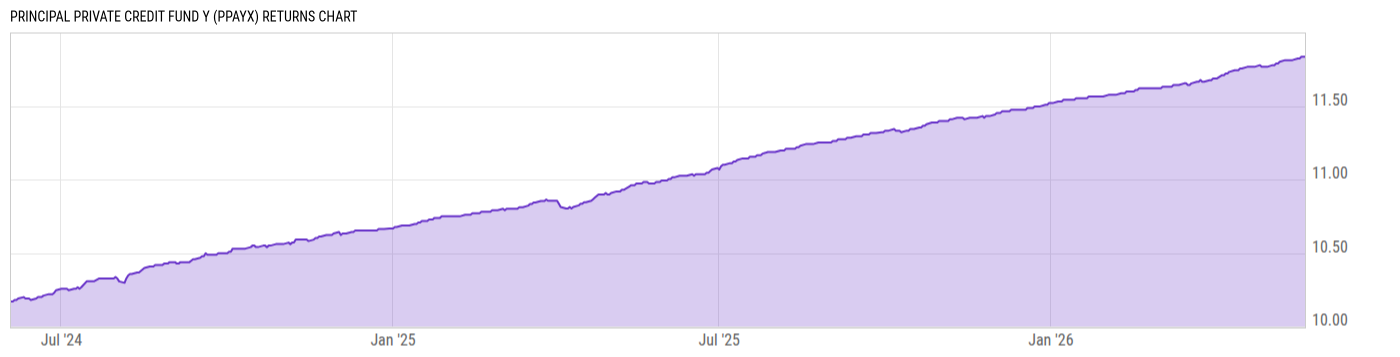
Principal Private Credit Fund Y (PPAYX)
10.43
0.00 (0.00%)
USD |
Jun 10 2026
Returns Chart
Key Stats
| Net Expense Ratio | Total Assets Under Management | Weighted Average Dividend Yield | Turnover Ratio (Generic) |
|---|---|---|---|
| 2.10% | 122.15M | -- | 15.00% |
| 1 Year Fund Level Flows | 1 Year Total Returns (Daily) | Annualized Total Returns Since Inception (Daily) | Max Drawdown (Since Inception) |
| -- | 7.65% |
Basic Info
| Investment Strategy | |
| The Fund seeks to maximize total return, consisting of current income and capital appreciation. The Fund invests at least 80% of its net assets, plus any borrowings for investment purposes, in private credit investments, including equity securities added to debt instruments to make them more desirable. |
| General | |
| Security Type | Unlisted Closed-End Fund |
| Equity Style | -- |
| Broad Asset Class | Taxable Bond |
| Broad Category | Fixed Income |
| Global Peer Group | Loan Participation Funds |
| Peer Group | Loan Participation Funds |
| Global Macro | Loan Participation Funds |
| US Macro | General Domestic Taxable Fixed Income Funds |
| YCharts Categorization | -- |
| YCharts Benchmark | -- |
| Prospectus Objective | Loan Participation Funds |
| Fund Owner Firm Name | Principal |
| Broad Asset Class Benchmark Index | |
| ^BBUSATR | 100.0% |
Net Fund Flows Versus Peer Group
1 Month
% Rank:
--
-120.38M
Peer Group Low
1.130B
Peer Group High
1 Year
% Rank:
--
-1.857B
Peer Group Low
6.524B
Peer Group High
3 Months
% Rank:
--
-902.22M
Peer Group Low
2.516B
Peer Group High
3 Years
% Rank:
--
-2.611B
Peer Group Low
21.94B
Peer Group High
6 Months
% Rank:
--
-1.596B
Peer Group Low
4.432B
Peer Group High
5 Years
% Rank:
--
-4.547B
Peer Group Low
24.56B
Peer Group High
YTD
% Rank:
--
-1.334B
Peer Group Low
3.795B
Peer Group High
10 Years
% Rank:
--
-10.87B
Peer Group Low
25.40B
Peer Group High
Date Unavailable
Risk
Performance Versus Peer Group
Annual Total Returns Versus Peers
As of June 11, 2026.
Asset Allocation
As of March 31, 2026.
| Type | % Net |
|---|---|
| Cash | -14.69% |
| Stock | 0.35% |
| Bond | 113.1% |
| Convertible | 0.00% |
| Preferred | 0.03% |
| Other | 1.19% |
Top 10 Holdings
| Name | % Weight | Price | % Change |
|---|---|---|---|
|
CompletePet Florida LLC FRN 06-Feb-2030
|
4.05% | -- | -- |
|
Trident Borrower LLC FRN 05-Mar-2032
|
3.84% | -- | -- |
|
Riverview Landscape Holdings LLC FRN 29-Jan-2030
|
3.52% | -- | -- |
|
SSA Acquisition Holdco LLC FRN 25-Jul-2029
|
3.41% | -- | -- |
|
Diaspora Tea & Herb Company LLC FRN 18-Feb-2032
|
3.33% | -- | -- |
|
Barricade Holdings LLC FRN 30-Sep-2030
|
3.08% | -- | -- |
| Morgan Stanley Inst Liq Govt Port Institutional | 2.85% | 1.00 | 0.00% |
|
PTS HoldCo Inc FRN 04-Mar-2031
|
2.32% | -- | -- |
|
Pediatric Home Respiratory Services LLC 23-DEC-2030 Term Loan
|
2.31% | -- | -- |
|
Sales Performance International LLC FRN 24-Aug-2028
|
2.19% | -- | -- |
Fees & Availability
| Fees | |
| Actual 12B-1 Fee | -- |
| Actual Management Fee | -- |
| Administration Fee | 56.98K% |
| Maximum Front Load | -- |
| Maximum Deferred Load | -- |
| Maximum Redemption Fee | -- |
| General Availability | |
| Available for Insurance Product | No |
| Available for RRSP | No |
| Purchase Details | |
| Open to New Investors |
|
| Minimum Initial Investment | 100000.0 None |
| Minimum Subsequent Investment | 0.00 None |
Basic Info
| Investment Strategy | |
| The Fund seeks to maximize total return, consisting of current income and capital appreciation. The Fund invests at least 80% of its net assets, plus any borrowings for investment purposes, in private credit investments, including equity securities added to debt instruments to make them more desirable. |
| General | |
| Security Type | Unlisted Closed-End Fund |
| Equity Style | -- |
| Broad Asset Class | Taxable Bond |
| Broad Category | Fixed Income |
| Global Peer Group | Loan Participation Funds |
| Peer Group | Loan Participation Funds |
| Global Macro | Loan Participation Funds |
| US Macro | General Domestic Taxable Fixed Income Funds |
| YCharts Categorization | -- |
| YCharts Benchmark | -- |
| Prospectus Objective | Loan Participation Funds |
| Fund Owner Firm Name | Principal |
| Broad Asset Class Benchmark Index | |
| ^BBUSATR | 100.0% |
Fundamentals
| General | |
| Distribution Yield | -- |
| Dividend Yield TTM (6-10-26) | 7.04% |
| 30-Day SEC Yield | -- |
| 7-Day SEC Yield | -- |
| Number of Holdings | 145 |
| Bond | |
| Yield to Maturity (3-31-26) | 6.65% |
| Effective Duration | -- |
| Average Coupon | 7.20% |
| Calculated Average Quality | 5.771 |
| Effective Maturity | 4.121 |
| Nominal Maturity | 4.142 |
| Number of Bond Holdings | 130 |
As of March 31, 2026
Fund Details
Top Portfolio Holders
| Name | % Weight |
|---|---|
| Portfolio A | 5.00% |
| Portfolio B | 3.50% |
| Portfolio C | 2.25% |