

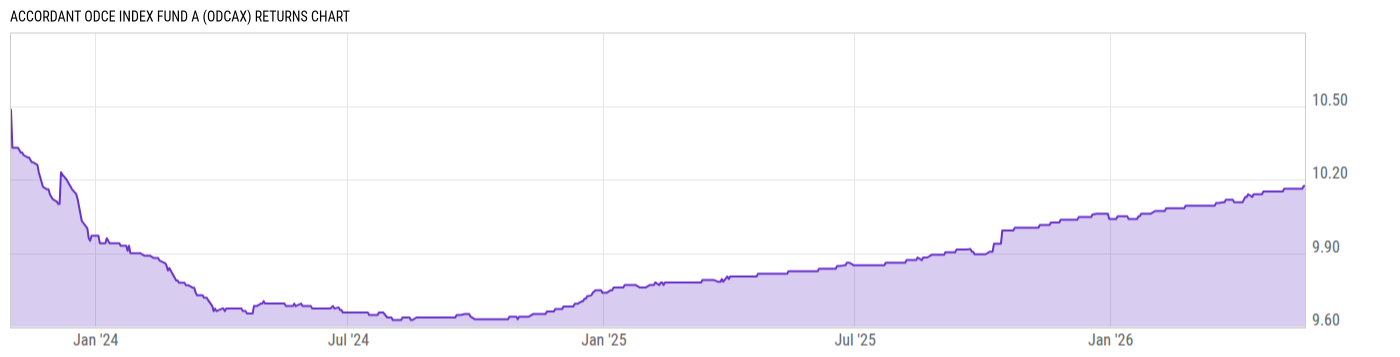
Accordant ODCE Index Fund A (ODCAX)
9.21
0.00 (0.00%)
USD |
Jun 10 2026
Returns Chart
Key Stats
| Net Expense Ratio | Total Assets Under Management | Weighted Average Dividend Yield | Turnover Ratio (Generic) |
|---|---|---|---|
| 1.36% | 165.12M | -- | 10.00% |
| 1 Year Fund Level Flows | 1 Year Total Returns (Daily) | Annualized Total Returns Since Inception (Daily) | Max Drawdown (Since Inception) |
| -- | 3.54% |
Basic Info
| Investment Strategy | |
| The Fund seeks to employ an indexing investment approach that seeks to track the NCREIF Fund Index Open End Diversified Core Equity ("NFI-ODCE Index"), (the Eligible Component Funds) on a net-of-fee basis while minimizing tracking error. This policy is subject to change only upon 60 days prior notice to shareholders |
| General | |
| Security Type | Unlisted Closed-End Fund |
| Equity Style | -- |
| Broad Asset Class | Sector Equity |
| Broad Category | Equity |
| Global Peer Group | Equity Sector Real Estate US |
| Peer Group | Real Estate Funds |
| Global Macro | Equity Real Estate |
| US Macro | Sector Equity Funds |
| YCharts Categorization | -- |
| YCharts Benchmark | -- |
| Prospectus Objective | Real Estate Funds |
| Fund Owner Firm Name | Accordant |
| Broad Asset Class Benchmark Index | |
| ^MSWNTR | 100.0% |
Net Fund Flows Versus Peer Group
1 Month
% Rank:
--
-1.958B
Peer Group Low
833.28M
Peer Group High
1 Year
% Rank:
--
-1.347B
Peer Group Low
1.065B
Peer Group High
3 Months
% Rank:
--
-1.898B
Peer Group Low
668.26M
Peer Group High
3 Years
% Rank:
--
-5.005B
Peer Group Low
2.527B
Peer Group High
6 Months
% Rank:
--
-1.720B
Peer Group Low
695.56M
Peer Group High
5 Years
% Rank:
--
-7.674B
Peer Group Low
3.884B
Peer Group High
YTD
% Rank:
--
-1.797B
Peer Group Low
318.65M
Peer Group High
10 Years
% Rank:
--
-7.585B
Peer Group Low
6.608B
Peer Group High
Date Unavailable
Risk
Performance Versus Peer Group
Annual Total Returns Versus Peers
As of June 11, 2026.
Asset Allocation
As of December 31, 2025.
| Type | % Net |
|---|---|
| Cash | 5.64% |
| Stock | 6.35% |
| Bond | 7.50% |
| Convertible | 0.00% |
| Preferred | 0.00% |
| Other | 80.51% |
Top 10 Holdings
| Name | % Weight | Price | % Change |
|---|---|---|---|
|
Prime Property Fund LLC
|
14.15% | -- | -- |
| Fidelity Instl Government Portfolio I | 13.14% | 1.00 | 0.00% |
|
Prisa LP
|
12.96% | -- | -- |
|
SPF FIV 2 US LP
|
7.74% | -- | -- |
|
CBRE US Core Partners Fund
|
5.77% | -- | -- |
|
Clarion Lion Properties Fund LLC
|
5.56% | -- | -- |
|
TA Realty Core Property Fund LP
|
5.03% | -- | -- |
|
RREEF America II LP
|
4.43% | -- | -- |
|
LaSalle Property Fund LP
|
4.27% | -- | -- |
|
MetLife Core Property Fund LP
|
3.86% | -- | -- |
Fees & Availability
| Fees | |
| Actual 12B-1 Fee | 0.25% |
| Actual Management Fee | -- |
| Administration Fee | 73.00% |
| Maximum Front Load | 5.75% |
| Maximum Deferred Load | -- |
| Maximum Redemption Fee | -- |
| General Availability | |
| Available for Insurance Product | No |
| Available for RRSP | No |
| Purchase Details | |
| Open to New Investors |
|
| Minimum Initial Investment | 2500.00 None |
| Minimum Subsequent Investment | 0.00 None |
Basic Info
| Investment Strategy | |
| The Fund seeks to employ an indexing investment approach that seeks to track the NCREIF Fund Index Open End Diversified Core Equity ("NFI-ODCE Index"), (the Eligible Component Funds) on a net-of-fee basis while minimizing tracking error. This policy is subject to change only upon 60 days prior notice to shareholders |
| General | |
| Security Type | Unlisted Closed-End Fund |
| Equity Style | -- |
| Broad Asset Class | Sector Equity |
| Broad Category | Equity |
| Global Peer Group | Equity Sector Real Estate US |
| Peer Group | Real Estate Funds |
| Global Macro | Equity Real Estate |
| US Macro | Sector Equity Funds |
| YCharts Categorization | -- |
| YCharts Benchmark | -- |
| Prospectus Objective | Real Estate Funds |
| Fund Owner Firm Name | Accordant |
| Broad Asset Class Benchmark Index | |
| ^MSWNTR | 100.0% |
Fundamentals
| General | |
| Distribution Yield | -- |
| Dividend Yield TTM (6-10-26) | 4.02% |
| 30-Day SEC Yield | -- |
| 7-Day SEC Yield | -- |
| Number of Holdings | 23 |
Top Portfolio Holders
| Name | % Weight |
|---|---|
| Portfolio A | 5.00% |
| Portfolio B | 3.50% |
| Portfolio C | 2.25% |