

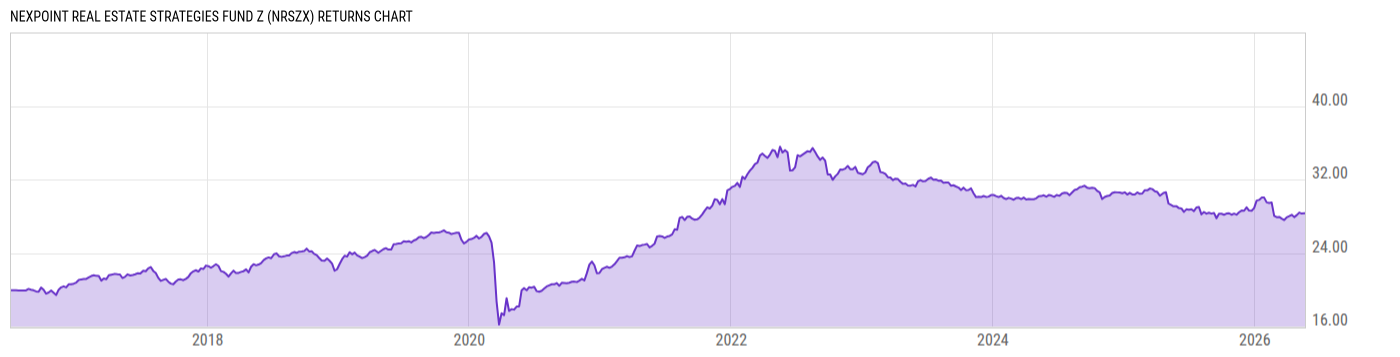
NexPoint Real Estate Strategies Fund Z (NRSZX)
12.96
-0.02
(-0.15%)
USD |
Jun 10 2026
Returns Chart
Key Stats
| Net Expense Ratio | Total Assets Under Management | Weighted Average Dividend Yield | Turnover Ratio (Generic) |
|---|---|---|---|
| 1.68% | 23.20M | -- | 3.00% |
| 1 Year Fund Level Flows | 1 Year Total Returns (Daily) | Annualized Total Returns Since Inception (Daily) | Max Drawdown (Since Inception) |
| -- | -2.75% |
Basic Info
| Investment Strategy | |
| The Fund seeks long-term total return, with an emphasis on current income, by primarily investing in a broad range of real estate-related debt, equity and preferred equity investments across multiple real estate sectors. It will invest at least 80% of its assets in real estate and real estate related securities. |
| General | |
| Security Type | Unlisted Closed-End Fund |
| Equity Style | -- |
| Broad Asset Class | Sector Equity |
| Broad Category | Equity |
| Global Peer Group | Equity Sector Real Estate US |
| Peer Group | Real Estate Funds |
| Global Macro | Equity Real Estate |
| US Macro | Sector Equity Funds |
| YCharts Categorization | -- |
| YCharts Benchmark | -- |
| Prospectus Objective | Real Estate Funds |
| Fund Owner Firm Name | NexPoint |
| Broad Asset Class Benchmark Index | |
| ^MSWNTR | 100.0% |
Net Fund Flows Versus Peer Group
1 Month
% Rank:
--
-1.958B
Peer Group Low
833.28M
Peer Group High
1 Year
% Rank:
--
-1.347B
Peer Group Low
1.065B
Peer Group High
3 Months
% Rank:
--
-1.898B
Peer Group Low
668.26M
Peer Group High
3 Years
% Rank:
--
-5.005B
Peer Group Low
2.527B
Peer Group High
6 Months
% Rank:
--
-1.720B
Peer Group Low
695.56M
Peer Group High
5 Years
% Rank:
--
-7.674B
Peer Group Low
3.884B
Peer Group High
YTD
% Rank:
--
-1.797B
Peer Group Low
318.65M
Peer Group High
10 Years
% Rank:
--
-7.585B
Peer Group Low
6.608B
Peer Group High
Date Unavailable
Risk
Performance Versus Peer Group
Annual Total Returns Versus Peers
As of June 11, 2026.
Asset Allocation
As of December 31, 2025.
| Type | % Net |
|---|---|
| Cash | 23.52% |
| Stock | 76.40% |
| Bond | 22.50% |
| Convertible | 0.00% |
| Preferred | 15.78% |
| Other | -38.20% |
Top 10 Holdings
| Name | % Weight | Price | % Change |
|---|---|---|---|
|
NRESF REIT Sub LLC
|
37.96% | -- | -- |
| NexPoint Real Estate Finance, Inc. | 22.92% | 15.77 | 1.35% |
|
USD Cash
|
18.30% | -- | -- |
|
IQHQ LP PFD
|
12.49% | -- | -- |
|
IQHQ LP FRN 31-Dec-2049
|
9.26% | -- | -- |
|
Ground Lease REIT Inc 144a
|
8.43% | -- | -- |
|
NRES Storage Partner LLC FRN 01-Oct-2026
|
8.34% | -- | -- |
|
Iqhq Inc Warrant
|
6.35% | -- | -- |
|
Nexpoint Storage Pertner Inc PFD
|
4.61% | -- | -- |
|
NRES SPE LLC FRN
|
4.39% | -- | -- |
Fees & Availability
| Fees | |
| Actual 12B-1 Fee | -- |
| Actual Management Fee | 0.51% |
| Administration Fee | 34.78K% |
| Maximum Front Load | -- |
| Maximum Deferred Load | -- |
| Maximum Redemption Fee | -- |
| General Availability | |
| Available for Insurance Product | No |
| Available for RRSP | No |
| Purchase Details | |
| Open to New Investors |
|
| Minimum Initial Investment | 100000.0 None |
| Minimum Subsequent Investment | 0.00 None |
Basic Info
| Investment Strategy | |
| The Fund seeks long-term total return, with an emphasis on current income, by primarily investing in a broad range of real estate-related debt, equity and preferred equity investments across multiple real estate sectors. It will invest at least 80% of its assets in real estate and real estate related securities. |
| General | |
| Security Type | Unlisted Closed-End Fund |
| Equity Style | -- |
| Broad Asset Class | Sector Equity |
| Broad Category | Equity |
| Global Peer Group | Equity Sector Real Estate US |
| Peer Group | Real Estate Funds |
| Global Macro | Equity Real Estate |
| US Macro | Sector Equity Funds |
| YCharts Categorization | -- |
| YCharts Benchmark | -- |
| Prospectus Objective | Real Estate Funds |
| Fund Owner Firm Name | NexPoint |
| Broad Asset Class Benchmark Index | |
| ^MSWNTR | 100.0% |
Fundamentals
| General | |
| Distribution Yield | -- |
| Dividend Yield TTM (6-10-26) | 11.24% |
| 30-Day SEC Yield (11-30-19) | 0.00% |
| 7-Day SEC Yield | -- |
| Number of Holdings | 29 |
| Stock | |
| Weighted Average PE Ratio | 6.313 |
| Weighted Average Price to Sales Ratio | 2.218 |
| Weighted Average Price to Book Ratio | 0.9431 |
| Weighted Median ROE | 11.40% |
| Weighted Median ROA | 1.34% |
| ROI (TTM) | 11.38% |
| Return on Investment (TTM) | 11.38% |
| Earning Yield | 0.1702 |
| LT Debt / Shareholders Equity | 6.060 |
| Number of Equity Holdings | 14 |
| Bond | |
| Yield to Maturity (12-31-25) | -- |
| Effective Duration | -- |
| Average Coupon | -- |
| Calculated Average Quality | -- |
| Effective Maturity | -- |
| Nominal Maturity | -- |
| Number of Bond Holdings | 9 |
As of December 31, 2025
Growth Metrics
| EPS Growth (1Y) | 51.50% |
| EPS Growth (3Y) | -34.15% |
| EPS Growth (5Y) | -45.18% |
| Sales Growth (1Y) | 14.10% |
| Sales Growth (3Y) | 2.09% |
| Sales Growth (5Y) | 14.88% |
| Sales per Share Growth (1Y) | 12.42% |
| Sales per Share Growth (3Y) | 4.89% |
| Operating Cash Flow - Growth Rate (3Y) | -10.44% |
As of December 31, 2025
Top Portfolio Holders
| Name | % Weight |
|---|---|
| Portfolio A | 5.00% |
| Portfolio B | 3.50% |
| Portfolio C | 2.25% |