

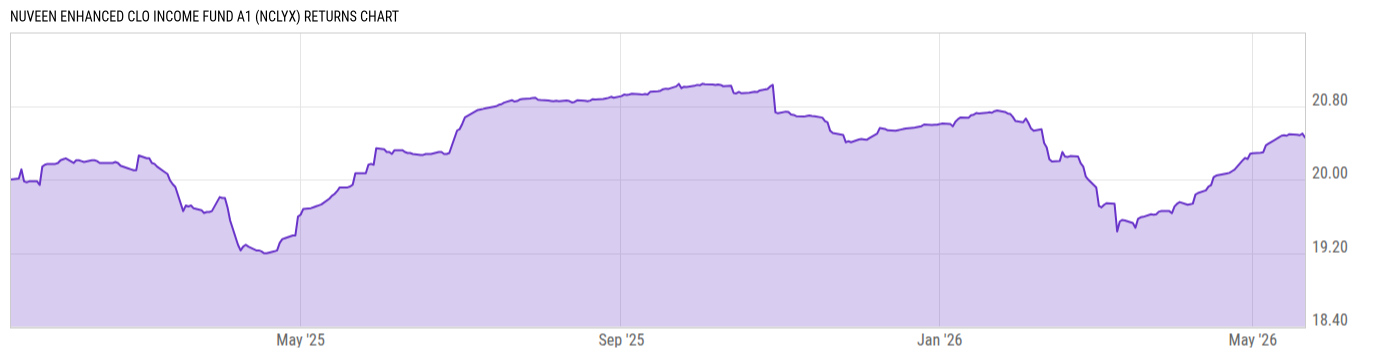
Nuveen Enhanced CLO Income Fund A1 (NCLYX)
17.58
-0.04
(-0.23%)
USD |
May 21 2026
Returns Chart
Key Stats
| Net Expense Ratio | Total Assets Under Management | Weighted Average Dividend Yield | Turnover Ratio (Generic) |
|---|---|---|---|
| 2.23% | 191.26M | -- | 29.00% |
| 1 Year Fund Level Flows | 1 Year Total Returns (Daily) | Annualized Total Returns Since Inception (Daily) | Max Drawdown (Since Inception) |
| -- | 2.58% |
Basic Info
| Investment Strategy | |
| The Fund seeks to generate attractive risk-adjusted returns. It will invest at least 80% of its Assets in collateralized loan obligations.The Fund will seek to capitalize on opportunities in the primary and secondary CLO markets. The Funds investments in CLOs are anticidated to generate high current income. |
| General | |
| Security Type | Unlisted Closed-End Fund |
| Equity Style | -- |
| Broad Asset Class | Taxable Bond |
| Broad Category | Fixed Income |
| Global Peer Group | Loan Participation Funds |
| Peer Group | Loan Participation Funds |
| Global Macro | Loan Participation Funds |
| US Macro | General Domestic Taxable Fixed Income Funds |
| YCharts Categorization | -- |
| YCharts Benchmark | -- |
| Prospectus Objective | Loan Participation Funds |
| Fund Owner Firm Name | Nuveen |
| Broad Asset Class Benchmark Index | |
| ^BBUSATR | 100.0% |
Net Fund Flows Versus Peer Group
1 Month
% Rank:
--
-253.42M
Peer Group Low
759.64M
Peer Group High
1 Year
% Rank:
--
-2.001B
Peer Group Low
5.560B
Peer Group High
3 Months
% Rank:
--
-1.463B
Peer Group Low
1.631B
Peer Group High
3 Years
% Rank:
--
-2.784B
Peer Group Low
21.89B
Peer Group High
6 Months
% Rank:
--
-1.675B
Peer Group Low
3.793B
Peer Group High
5 Years
% Rank:
--
-4.082B
Peer Group Low
24.26B
Peer Group High
YTD
% Rank:
--
-1.576B
Peer Group Low
2.664B
Peer Group High
10 Years
% Rank:
--
-10.84B
Peer Group Low
24.98B
Peer Group High
Date Unavailable
Risk
Performance Versus Peer Group
Annual Total Returns Versus Peers
As of May 22, 2026.
Asset Allocation
As of March 31, 2026.
| Type | % Net |
|---|---|
| Cash | 4.14% |
| Stock | 0.00% |
| Bond | 97.70% |
| Convertible | 0.00% |
| Preferred | 0.00% |
| Other | -1.83% |
Top 10 Holdings
| Name | % Weight | Price | % Change |
|---|---|---|---|
|
HAMLIN PARK CLO LTD 1 SUB VAR 20-OCT-2037
|
5.54% | -- | -- |
|
Stanwix CLO FRN 01-Dec-2030
|
4.83% | -- | -- |
|
Fixed Income Clearing Corp Repo
|
4.14% | -- | -- |
|
NEUBERGER BERMAN CLO LTD 21RRR ER3 SEQ FLT 8.91763% 20-JAN-2039
|
3.95% | -- | -- |
|
ELMWOOD CLO 7RR ERR SEQ FLT 9.56763% 19-OCT-2037
|
2.44% | -- | -- |
|
CIFC FUNDING LTD 191R ER FLT 9.41763% 20-OCT-2037
|
2.18% | -- | -- |
|
KKR CLO LTD/LLC 40R ER SEQ FLT 10.91763% 20-OCT-2034
|
1.72% | -- | -- |
|
AIMCO CLO 18AR D1R SEQ FLT 6.73163% 19-OCT-2037
|
1.57% | -- | -- |
|
NEUBERGER BERMAN LOAN ADVISERS LLC 24RR ER2 SEQ FLT 10.66763% 19-OCT-2038
|
1.52% | -- | -- |
|
ARES CLO LTD 34R4 ER2 SEQ FLT 9.38163% 19-JUL-2038
|
1.51% | -- | -- |
Fees & Availability
| Fees | |
| Actual 12B-1 Fee | 0.75% |
| Actual Management Fee | 1.35% |
| Administration Fee | -- |
| Maximum Front Load | 2.50% |
| Maximum Deferred Load | -- |
| Maximum Redemption Fee | -- |
| General Availability | |
| Available for Insurance Product | No |
| Available for RRSP | No |
| Purchase Details | |
| Open to New Investors |
|
| Minimum Initial Investment | 2500.00 None |
| Minimum Subsequent Investment | 100.00 None |
Basic Info
| Investment Strategy | |
| The Fund seeks to generate attractive risk-adjusted returns. It will invest at least 80% of its Assets in collateralized loan obligations.The Fund will seek to capitalize on opportunities in the primary and secondary CLO markets. The Funds investments in CLOs are anticidated to generate high current income. |
| General | |
| Security Type | Unlisted Closed-End Fund |
| Equity Style | -- |
| Broad Asset Class | Taxable Bond |
| Broad Category | Fixed Income |
| Global Peer Group | Loan Participation Funds |
| Peer Group | Loan Participation Funds |
| Global Macro | Loan Participation Funds |
| US Macro | General Domestic Taxable Fixed Income Funds |
| YCharts Categorization | -- |
| YCharts Benchmark | -- |
| Prospectus Objective | Loan Participation Funds |
| Fund Owner Firm Name | Nuveen |
| Broad Asset Class Benchmark Index | |
| ^BBUSATR | 100.0% |
Fundamentals
| General | |
| Distribution Yield | -- |
| Dividend Yield TTM (5-21-26) | 12.79% |
| 30-Day SEC Yield | -- |
| 7-Day SEC Yield | -- |
| Number of Holdings | 122 |
| Bond | |
| Yield to Maturity (3-31-26) | 9.19% |
| Effective Duration | -- |
| Average Coupon | 9.19% |
| Calculated Average Quality | 4.813 |
| Effective Maturity | 10.81 |
| Nominal Maturity | 10.81 |
| Number of Bond Holdings | 113 |
As of March 31, 2026
Fund Details
Top Portfolio Holders
| Name | % Weight |
|---|---|
| Portfolio A | 5.00% |
| Portfolio B | 3.50% |
| Portfolio C | 2.25% |