

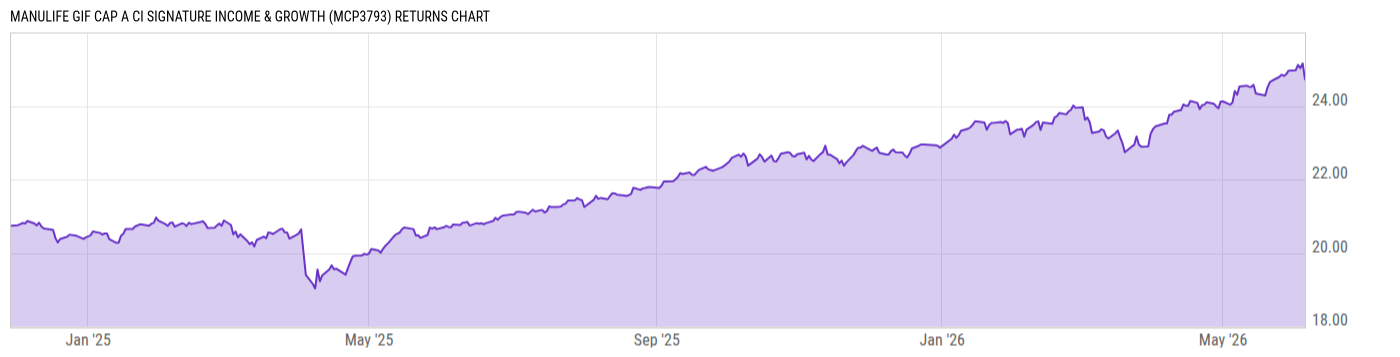
Manulife GIF CAP A CI Signature Income & Growth (MCP3793)
24.73
-0.43
(-1.71%)
CAD |
Jun 05 2026
Returns Chart
Key Stats
| Net Expense Ratio | Total Assets Under Management | Weighted Average Dividend Yield | Turnover Ratio (Generic) |
|---|---|---|---|
| 4.08% | 394.24M | -- | -- |
| 1 Year Fund Level Flows | 1 Year Total Returns (Daily) | Annualized Total Returns Since Inception (Daily) | Max Drawdown (Since Inception) |
| -27.79M | 19.48% |
Basic Info
| Investment Strategy | |
| The fund seeks to provide a steady flow of current income while preserving capital by investing in a diversified portfolio of securities composed mainly of equity, equity-related and fixed income securities of Canadian issuers. The fund may also invest in foreign securities. |
| General | |
| Security Type | Insurance Fund |
| Equity Style | -- |
| Broad Asset Class | Allocation |
| Broad Category | Allocation |
| Global Peer Group | Mixed Asset CAD Balanced - Global |
| Peer Group | Global Neutral Balanced |
| Global Macro | -- |
| US Macro | -- |
| YCharts Categorization | -- |
| YCharts Benchmark | -- |
| Prospectus Objective | -- |
| Fund Owner Firm Name | Manulife |
| Broad Asset Class Benchmark Index | |
| ^SPTSX60TR | 100.0% |
Net Fund Flows Versus Peer Group
1 Month
% Rank:
65
-212.75M
Peer Group Low
358.00M
Peer Group High
1 Year
% Rank:
73
-27.79M
-2.642B
Peer Group Low
6.806B
Peer Group High
3 Months
% Rank:
59
-795.24M
Peer Group Low
1.217B
Peer Group High
3 Years
% Rank:
72
-2.980B
Peer Group Low
11.88B
Peer Group High
6 Months
% Rank:
75
-1.524B
Peer Group Low
5.121B
Peer Group High
5 Years
% Rank:
74
-3.315B
Peer Group Low
18.25B
Peer Group High
YTD
% Rank:
67
-1.117B
Peer Group Low
2.250B
Peer Group High
10 Years
% Rank:
89
-2.814B
Peer Group Low
31.56B
Peer Group High
Date Unavailable
Risk
Performance Versus Peer Group
Annual Total Returns Versus Peers
As of June 08, 2026.
Asset Allocation
As of April 30, 2026.
| Type | % Net |
|---|---|
| Cash | 1.24% |
| Stock | 59.76% |
| Bond | 32.09% |
| Convertible | 0.00% |
| Preferred | 1.50% |
| Other | 5.41% |
Top 2 Holdings
| Name | % Weight | Price | % Change |
|---|---|---|---|
|
CI CANADIAN INCOME & GROWTH FUND SERIES I
|
100.0% | -- | -- |
|
CAD CASH
|
-0.04% | -- | -- |
Fees & Availability
| Fees | |
| Actual 12B-1 Fee | -- |
| Actual Management Fee | -- |
| Administration Fee | -- |
| Maximum Front Load | -- |
| Maximum Deferred Load | -- |
| Maximum Redemption Fee | -- |
| General Availability | |
| Available for Insurance Product |
|
| Available for RRSP |
|
| Purchase Details | |
| Open to New Investors |
|
| Minimum Initial Investment | 500.00 None |
| Minimum Subsequent Investment | 30.00 None |
Basic Info
| Investment Strategy | |
| The fund seeks to provide a steady flow of current income while preserving capital by investing in a diversified portfolio of securities composed mainly of equity, equity-related and fixed income securities of Canadian issuers. The fund may also invest in foreign securities. |
| General | |
| Security Type | Insurance Fund |
| Equity Style | -- |
| Broad Asset Class | Allocation |
| Broad Category | Allocation |
| Global Peer Group | Mixed Asset CAD Balanced - Global |
| Peer Group | Global Neutral Balanced |
| Global Macro | -- |
| US Macro | -- |
| YCharts Categorization | -- |
| YCharts Benchmark | -- |
| Prospectus Objective | -- |
| Fund Owner Firm Name | Manulife |
| Broad Asset Class Benchmark Index | |
| ^SPTSX60TR | 100.0% |
Fundamentals
| General | |
| Distribution Yield | -- |
| Dividend Yield TTM (6-5-26) | 0.00% |
| 30-Day SEC Yield | -- |
| 7-Day SEC Yield | -- |
| Number of Holdings | 2 |
| Stock | |
| Weighted Average PE Ratio | 26.92 |
| Weighted Average Price to Sales Ratio | 6.507 |
| Weighted Average Price to Book Ratio | 5.527 |
| Weighted Median ROE | 23.33% |
| Weighted Median ROA | 9.73% |
| ROI (TTM) | 14.66% |
| Return on Investment (TTM) | 14.66% |
| Earning Yield | 0.0493 |
| LT Debt / Shareholders Equity | 0.6802 |
| Number of Equity Holdings | 0 |
| Bond | |
| Yield to Maturity (4-30-26) | 5.29% |
| Effective Duration | -- |
| Average Coupon | 5.66% |
| Calculated Average Quality | 3.973 |
| Effective Maturity | 10.82 |
| Nominal Maturity | 13.61 |
| Number of Bond Holdings | 0 |
As of April 30, 2026
Growth Metrics
| EPS Growth (1Y) | 37.57% |
| EPS Growth (3Y) | 14.32% |
| EPS Growth (5Y) | 19.40% |
| Sales Growth (1Y) | 16.57% |
| Sales Growth (3Y) | 10.85% |
| Sales Growth (5Y) | 13.14% |
| Sales per Share Growth (1Y) | 18.64% |
| Sales per Share Growth (3Y) | 11.80% |
| Operating Cash Flow - Growth Rate (3Y) | 22.06% |
As of April 30, 2026
Fund Details
| Key Dates | |
| Launch Date | 10/25/2007 |
| Last Annual Report Date | 12/31/2024 |
| Last Prospectus Date | -- |
| Share Classes | |
| MCP3493 | Commission-based Advice |
| MGE1420 | Commission-based Advice |
| MGE1820 | Commission-based Advice |
| MGF6052 | Fee-based Advice |
| MGF6152 | Fee-based Advice |
| MGF6252 | Fee-based Advice |
| MGF6752 | Commission-based Advice |
| MGF7052 | Commission-based Advice |
| MGF7352 | Fee-based Advice |
| MGF8052 | Commission-based Advice |
| MGF8352 | -- |
| MGF8652 | -- |
| MGF8752 | Commission-based Advice |
| MGF8852 | -- |
| MGF9152 | -- |
| MGS2052 | -- |
| MGS2352 | Commission-based Advice |
| MGS2652 | -- |
| MGS2752 | Commission-based Advice |
| MIF1220 | Commission-based Advice |
| MIF1620 | Commission-based Advice |
| MLC5493 | Commission-based Advice |
| MLC5793 | Commission-based Advice |
| MLP4393 | Commission-based Advice |
| MLP4793 | Commission-based Advice |
| MRP1215 | Commission-based Advice |
| MRP1789 | Fee-based Advice |
| MRP1889 | Commission-based Advice |
| Attributes | |
| Index Fund | -- |
| Inverse Fund | No |
| Leveraged Fund | -- |
| Fund of Funds | No |
| Currency Hedged Fund | -- |
| Socially Responsible Fund | No |
Top Portfolio Holders
| Name | % Weight |
|---|---|
| Portfolio A | 5.00% |
| Portfolio B | 3.50% |
| Portfolio C | 2.25% |